Join Our Telegram channel to stay up to date on breaking news coverage
Price Systemically Pushes High – March 27
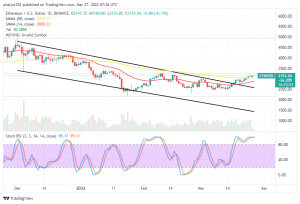
It’s been a while that the ETH/USD market activities, featuring a slow-and-steady moving manner, give no reliable reversal for short-position takers to count on. It is still on the crypto-economic book of records that price systemically pushes high between $3,169 and $3,135 at a minute positive percentage of 0.19.
Price Systemically Pushes High: ETH Market
Key Levels:
Resistance levels: $3,250, $3,500, $3,750
Support levels: $3,000, $2,750, $2,500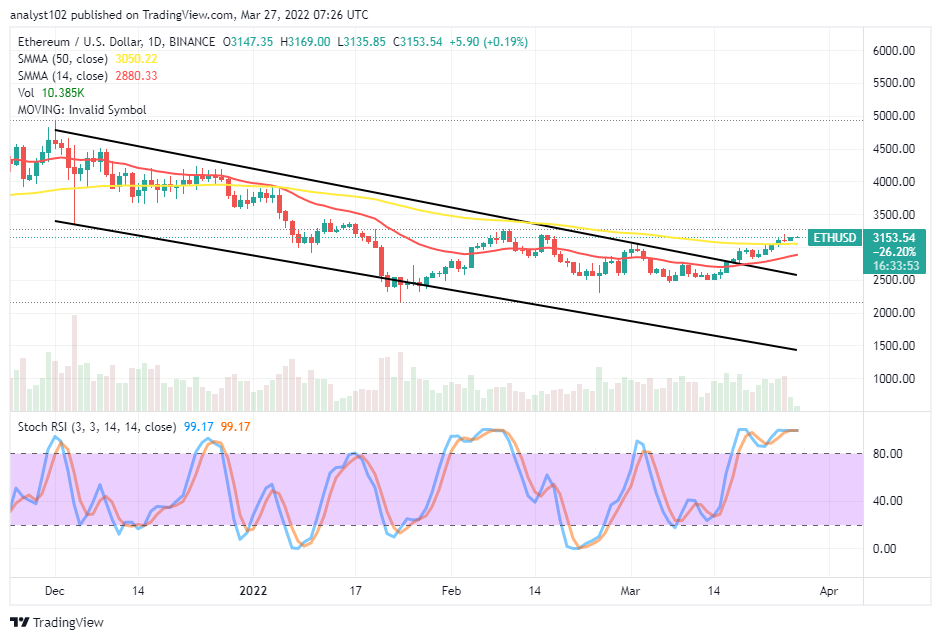 ETH/USD – Daily Chart
The ETH/USD daily chart reveals the crypto-economic market price systemically pushes high briefly past the trend line of the bigger SMA. The 14-day SMA indicator is underneath the 50-day SMA indicator. The Stochastic Oscillators are in the overbought region, moving in a consolidation manner. The current pushes to the upside in this crypto-economy yet appears to be forthcoming in a rallying status. Nevertheless, traders may stay off the market until some degrees of active price actions re-surface.
Can there be more pressures to the upside as the ETH/USD price systemically pushes high?
The present trading outlook in the ETH/USD market operations doesn’t signify a definite direction as the crypto-economic price systemically pushes high above the SMA trend lines. Some smaller bullish candlesticks are being featured closely above the bigger SMA, even making it uneasy to observe either buying or selling orders at the pace of what the market keeps. Above all, long-position takers needed to be cautious of exerting new position orders.
On the downside of the technical analysis, the ETH/USD market short-position takers may keep on the lookout manner to observe when the price will attempt reversing on a higher mode to launch a sell order. The lower timeframes such as 1-hour and 4-hour are good enough in deciding the presumed trading moment. There can also be a prolonged delay of inactive price motions to back the much-expected return of a downward trend.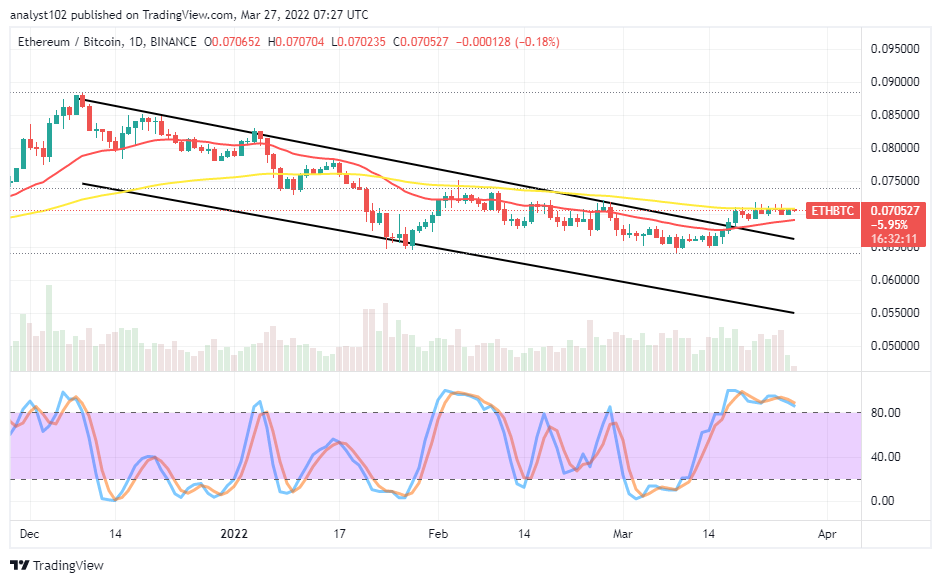
ETH/BTC Price Analysis
In comparison, Ethereum is striving to push more against Bitcoin as a line of variant candlesticks has been forming around the trend line of the bigger SMA. The 14-day SMA indicator is underneath the 50-day SMA indicator. The bearish channel trend lines are drawn southward closely beneath some candlesticks, expecting the base crypto to fall back into it in the long run. The Stochastic Oscillators are moving in a consolidation style in the overbought region, seemingly bending toward the south closely above the range at 80. That signifies the counter crypto may regain the momentum to move against the base crypto in no time.
Looking to buy or trade Bitcoin (BTC) now? Invest at eToro!
68% of retail investor accounts lose money when trading CFDs with this provider.
Read more:
Join Our Telegram channel to stay up to date on breaking news coverage