


Join Our Telegram channel to stay up to date on breaking news coverage
Price Rallies Below $3,000 – February 26
The ETH/USD market situation shows that crypto-economic price rallies closer below $3,000 resistance. The crypto business operation is currently trading between $2,872 and $2,730 at a minute negative percentage rate of 0.81.
Price Rallies Below $3,000: ETH Market
Key Levels:
Resistance levels: $3,000, $3,250, $3,500
Support levels: $2,500, $2,250, $2,000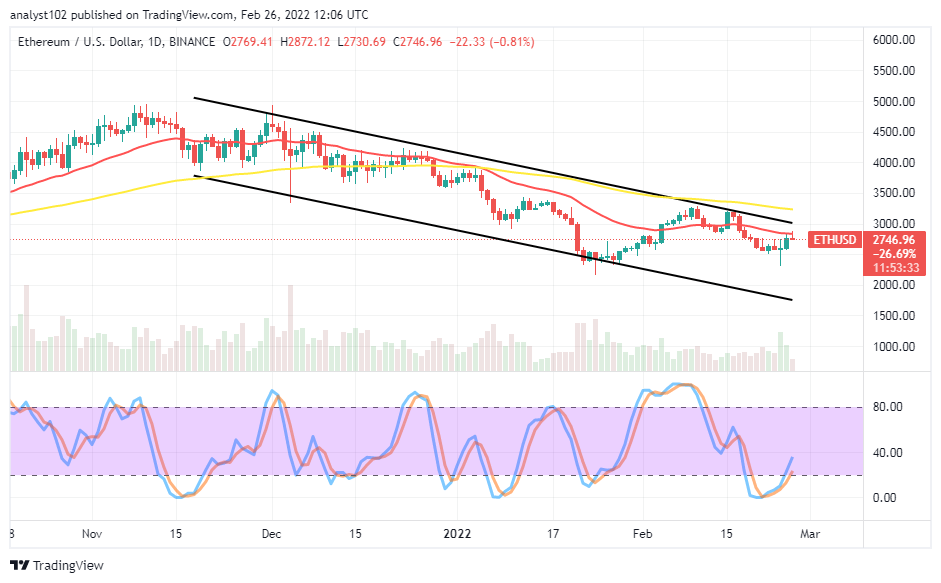 ETH/USD – Daily Chart
The ETH/USD daily chart shows the crypto-economic market price rallies below $3,000 after a significant fall-off. Variant candlesticks have been emerging to signify the ups and downs of the crypto market activities under the upper bearish trend line drawn. The Stochastic Oscillators are pointing toward the northbound direction to indicate that there can be more room for upward pressure.
Will there be responses to downing forces in the ETH/USD market operations as the crypto-economic price rallies below $3,000?
The movement of the ETH/USD market operations to the upside will allow the trade to garner catalyst at a higher resistance around the upper bearish trend line or in an extension manner of the 50-day SMA trend line. That is around a $3,250 resistance level zone. Those are the possible value-lines the market may beef up in increasing its valuations in the process. Price has been moving in a slow-and-steady that can give back to a southward turning in no time.
On the downside of the technical analysis, Price has initially pushed northward to touch a psychological resistance point around $2,870 to potentially set a selling entry zone against some upward-attempting motions afterward. The pointing posture of the Stochastic Oscillators to the north side closely beneath the range of 40 suggests the need to exercise patience before launching a sell order devoid of over leveraging, especially when much-active forces are backing a downward motion at this level of trading.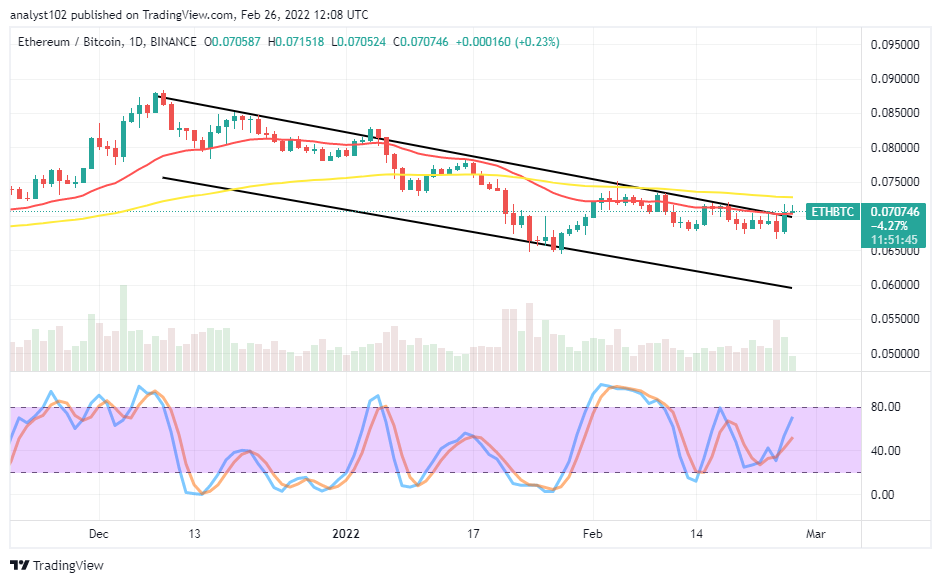
ETH/BTC Price Analysis
In comparison, Ethereum has somewhat been under a downward force with Bitcoin. Presently, the cryptocurrency pair price rallies around the trend line of the 14-day SMA. The 50-day SMA indicator is above the 14-day SMA indicator. The upper bearish trend line is drawn alongside the smaller SMA at the end to add more backings to the area of resistance positioning of it. The Stochastic Oscillators have swerved northbound from around the range of 40 closer to 80 range-lines. That signifies that the crypto pair price may not sustainably push further to the upside in the subsequent sessions.
Looking to buy or trade Bitcoin (BTC) now? Invest at eToro!
68% of retail investor accounts lose money when trading CFDs with this provider.
Read more:
Join Our Telegram channel to stay up to date on breaking news coverage
![Intel Corporation [INTC]](https://insidebitcoins.com/wp-content/uploads/2019/03/Intel-Corporation-INTC.jpg)