Join Our Telegram channel to stay up to date on breaking news coverage
Ethereum Price Prediction – July 22
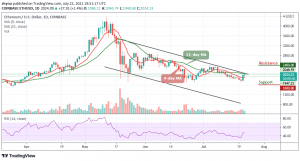
The Ethereum price is trying to keep its upward movement by crossing above the upper boundary of the channel.
ETH/USD Market
Key Levels:
Resistance levels: $2400, $2600, $2800
Support levels: $1600, $1400, $1200

Since the beginning of July, ETH/USD has been facing a downward trend, trading below the 9-day and 21-day moving averages.
The daily chart reveals that the coin pushes above the 21-day moving average today from the opening price of $1996 level to reach the daily high at $2046, before coming back to where it is currently trading at $2024.
Ethereum Price Prediction: Ethereum (ETH) May Create A New Trend
As revealed by the daily chart, the Ethereum price is moving towards the upside as the coin makes an attempt to cross above the upper boundary of the channel.
Meanwhile, ETH/USD remains in a bullish position despite being predictably rejected from the resistance level of $2046.
However, as long as the Ethereum (ETH) continues to trade within the 9-day 21-day MAs, it presents more of a chance of upward movement; although a break below it may signal a new bearish phase in the market.
Therefore, if we could see a tremendous climb above the 21-day MA which is fast approaching; it may likely reach the resistance at $2400, $2600, and $2800 levels.
Meanwhile, dropping below the 9-day moving average may reach the critical support levels of $1600, $1400, and $1200 respectively while the technical indicator Relative Strength Index (14) moves toward 50-level.
When compared with Bitcoin, Ethereum is following a bullish sentiment and it’s about to break above the 9-day moving average.
The coin has been suffering from a strong buying power as the bulls are trying to gain momentum as the sellers may release huge pressure on the market. For now, Ethereum is trading around 6261 SAT which is within the middle boundary of the channel.
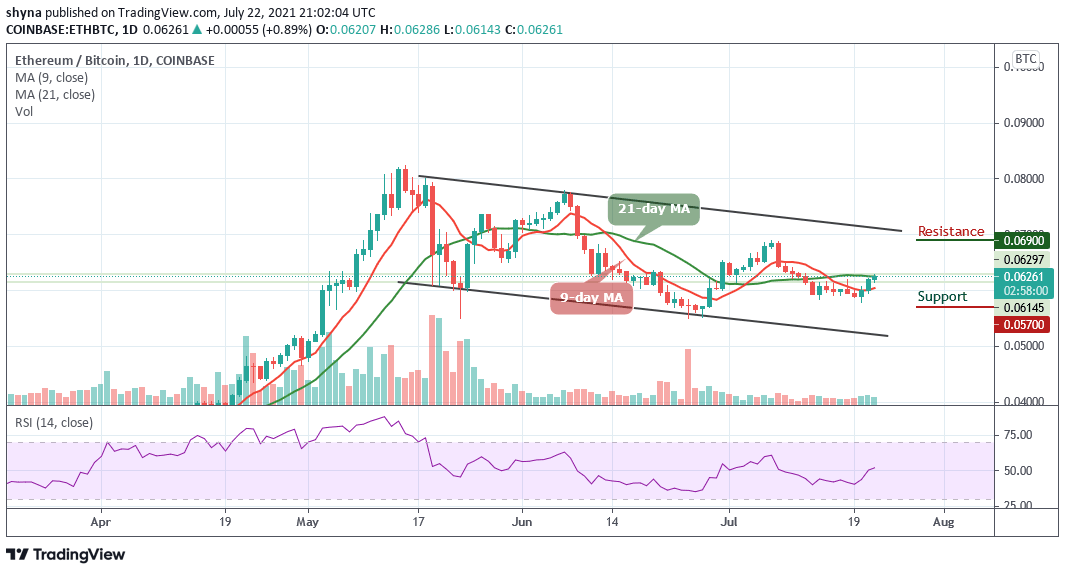
Currently, the technical indicator Relative Strength Index (14) is moving above 50-level. If the bulls manage to find resistance at this level, an upward movement could push the price to the 6900 SAT and potentially 7100 SAT resistance levels. But, a push below the 9-day MA could lead the market price to the support of 5700 SAT and below.
Looking to buy or trade Ethereum (ETH) now? Invest at eToro!
75% of retail investor accounts lose money when trading CFDs with this provider
Join Our Telegram channel to stay up to date on breaking news coverage