Join Our Telegram channel to stay up to date on breaking news coverage
Moves in Range-bound Zones – June 5
ETH/USD market operation currently moves in range-bound zones while it could not surge further northward past the resistance level of $3,000. The crypto economy records about -2.40% decrease to trade around the market line of $2,626.
Moves in Range-bound Zones: ETH Market
Key Levels:
Resistance levels: $3,000, $3,500, $4,000
Support levels: $2,200, $2,000, $1,800
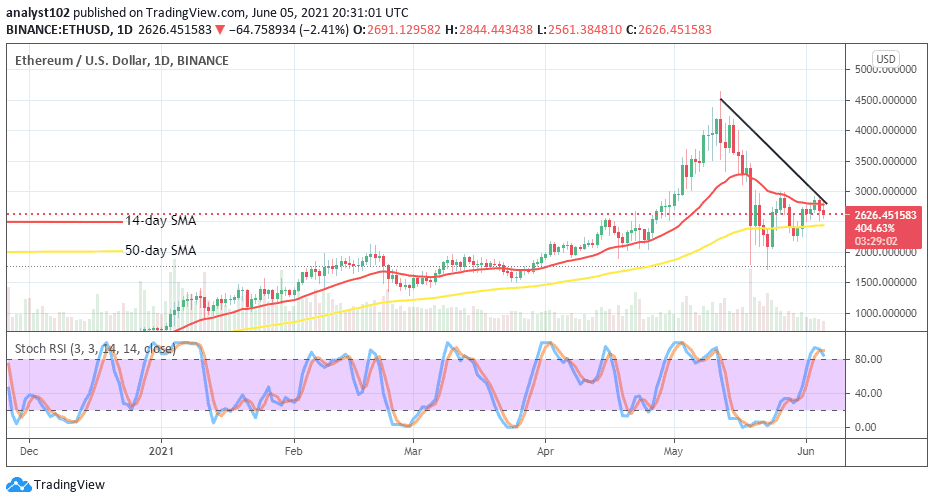
ETH/USD – Daily Chart
It is depicted on the ETH/USD daily chart that the crypto trade moves in range-bound zones found around the points $3,000 and $2,500. A small bearish candlestick took its form during yesterday’s trading session around the smaller SMA. The 50-day SMA indicator is located around the $25,000 as the 14-day SMA trend-line is located over it a bit below the immediate resistance of $3000. The bearish trend-line drew downward to keep a close position to the current situation. The Stochastic Oscillators are in the overbought region with the blue line crossing the red line slightly to the south near above range 80.
Looking to buy or trade Ethereum (ETH) now? Invest at eToro!
Why the current moves in range-bound zones of the ETH/USD market?
The major causative effect of the current moves in range-bound zones of Ethereum’s price as pairing with the US Dollar hasn’t far-fetched than being as a result of the less-impulsive pushes that exist between the two market-movers. As a result, it would be technically ideal that traders focus on two basic points of the range-bound zones in determining their entries.
As regards the decent entry of bears in this market operation, the trading area of upper range-bound zones would have to be placed under a watch to potentially get a sell entry of the crypto economy. Extension of a downward move from that zone could cause a slight breakdown of the lower range line that could also lead price to possibly revisit a lower support value of $2,000 afterward.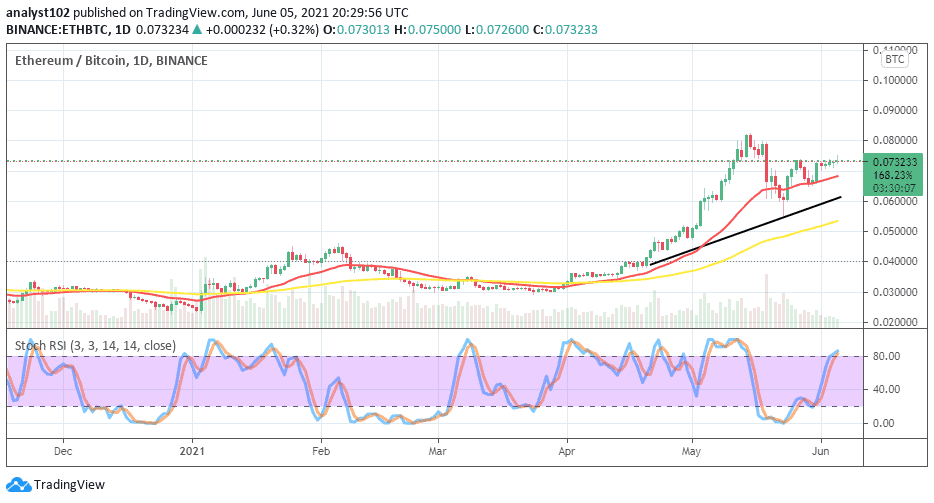
ETH/BTC Price Analysis
As it is showcased by the price analysis chart, Ethhereum possesses an outweighing trending capacity than Bitcoin in comparison. In the recent past, the base crypto’s valuation was reversed by the flagship counter trading instrument to locate support around the smaller SMA trend-line. The 14-day SMA is located over the 50-day SMA indicator as the bullish trend-line drew between them. And, they all point toward the north direction to indicate that the base crypto still somewhat plays a dominant role in trading against the trending capacity of the counter tool. The Stochastic Oscillators are a bit past range 80 to briefly state an overbought trading situation between the two cryptos. That suggests that ETH may in the near time have to relax their pushing potentials as paired with BTC for a while.
75% of retail investor accounts lose money when trading CFDs with this provider
Join Our Telegram channel to stay up to date on breaking news coverage