Join Our Telegram channel to stay up to date on breaking news coverage
Ethereum Price Prediction – September 10
The Ethereum price prediction has not been able to see any relief following the massive influx of selling pressure.
ETH/USD Market
Key Levels:
Resistance levels: $3800, $4000, $4200
Support levels: $3000, $2800, $2600

At the time of writing, ETH/USD is trading marginally at its current price of $3388.52. This is the price at which it has been trading for the past few days. However, ETH trends in the short term are likely to be heavily reliant on BTC, as the benchmark crypto has had a firm grip on its smaller counterparts of late.
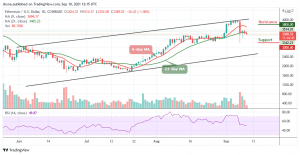
Ethereum Price Prediction: Ethereum (ETH) Not Ready for The Upside
The Ethereum price has been able to establish the $3352 region as a strong support zone. Every drop here has been faced with aggressive buying pressure. Therefore, if it sustains above the 9-day moving average, it could potentially start to navigate back to its resistance between the $3400 and $3500 resistance levels. If the buying pressure evaporates around $3100, it could see Ethereum incur some heavy downwards momentum that sends it to the supports at $3000, $2800, and $2600.
In the meantime, it is important to note that all these losses that the coin has suffered have fundamentally changed the structure of the cryptocurrency market. Traders are to note that ETH/USD in the short term could be positioned to see a significant downside effect. Buyers should be on the lookout for $3800, $4000, and $4200 as a target to watch and a strong bullish reaction at this level is vital for Ethereum to maintain its medium-term outlook while the Relative Strength Index (14) is seen moving below 55-level.
Against Bitcoin, we can see that Ethereum is clearly bearish. Meanwhile, as the price falls, the sellers are posing an additional threat for buyers to reach the support level of 7315 SAT where the nearest target is located. However, an eventual break below the 21-day moving average may cause Ethereum to collapse.
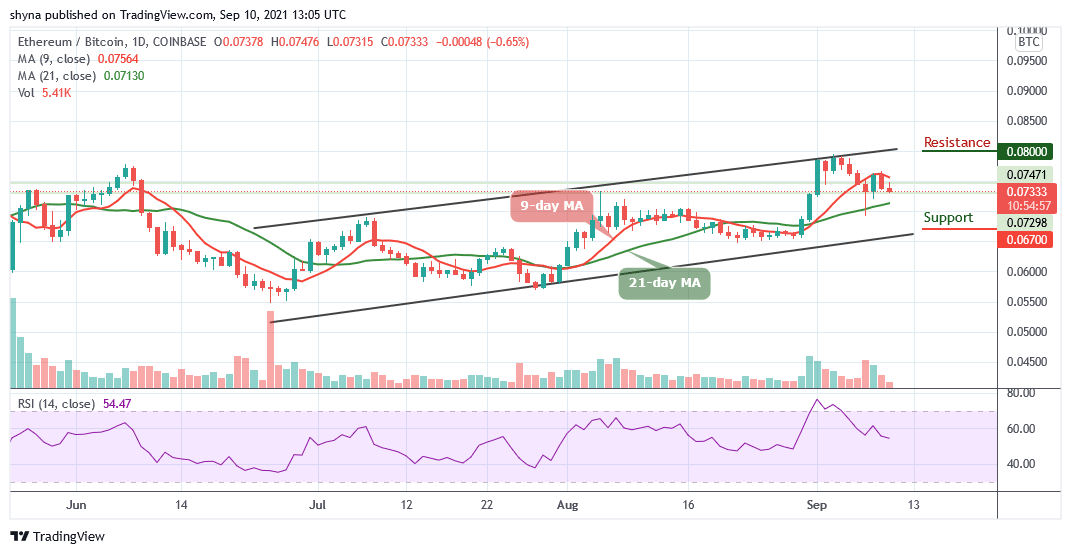
Meanwhile, the continuation of the downtrend could hit the main support at 7000 SAT before falling to 6700 SAT and below. More so, the buyers may likely push the market above the 9-day moving average to reach the potential resistance at 8000 SAT and above if a rebound plays out. The technical indicator Relative Strength Index (14) is moving below the 55-level indicating that the sellers are coming up.
Looking to buy or trade Ethereum (ETH) now? Invest at eToro!
67% of retail investor accounts lose money when trading CFDs with this provider
Read more:
Join Our Telegram channel to stay up to date on breaking news coverage