Join Our Telegram channel to stay up to date on breaking news coverage
Market Reverts into Previous Ranges– September 11
The ETH/USD market activity now reverts into the previous ranges marked by $3,500 and $3,000. The lately bearish motion has led the crypto market to trade around $3,310 at a percentage rate of about 3.16 positive.
Market Reverts into Previous Ranges: ETH Market
Key Levels:
Resistance levels: $3,500, $3,750, $4,000
Support levels: $3,000, $2,750, $2,500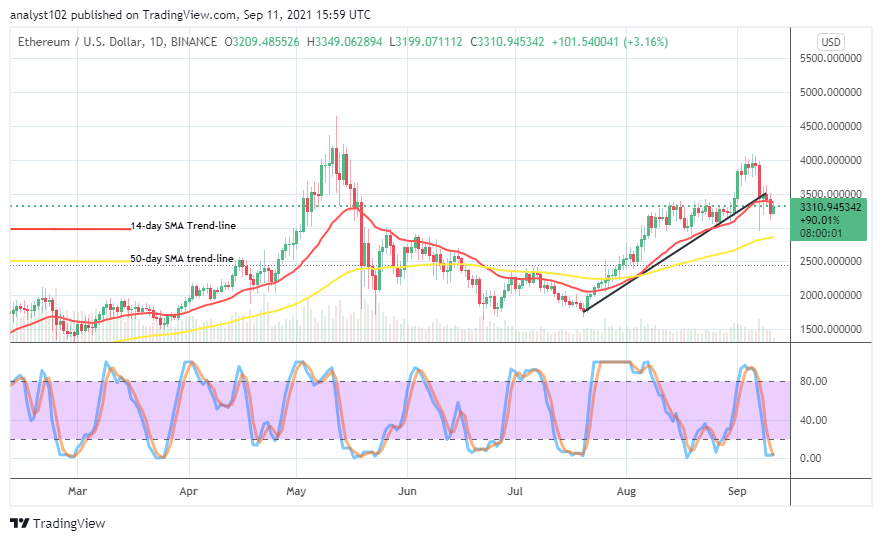
ETH/USD – Daily Chart
The ETH/USD daily chart gives that the crypto market reverts southward into its previous ranges. It recalled that variant candlesticks formed between $3,500 and $3,000 before the emergence of the 1st of September, skyrocketing the market’s valuation into near higher trading zones. The 50-day SMA trend line positions near, below the lower value point mentioned as both the bullish trend line, drew and the 14-day SMA indicator is above. The Stochastic Oscillators are in the oversold region, with the lines closed closer to the zero range line. That’s a potency that the market’s price will swing northward soon.
At this trading capacity level that the ETH/USD market reverts into its previous ranges, could price experience a round of another sideways motion?
There may be another short round of sideways motion in the latest previous ranges that price featured now that the ETH/USD market reverts southward into it. The two market movers will now have to be cautious of their positions re-launching. That said, a safe re-entry of an order will be found by bulls especially, while a downward motion appears to have exhausted at around the lower trading value of $3,000. The breaking out at the higher value line of $3,500 may not come to play out in the near time.
On the downside, the ETH/USD market bears seem losing the stance gradually as potentially portended by the readings of the Stochastic Oscillators in the oversold region. The holding of the market’s valuation close to the line at $3,000 may signal an uglier trading situation to the upside. In elaborative technical aspect, some more downs may feature on a systemic gradual form capable of causing panic sell-off moments.
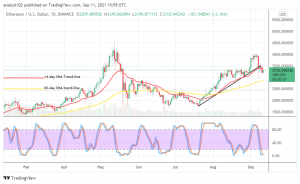
ETH/BTC Price Analysis
Despite that the cryptocurrency pair market reverts in ranges, the ETH/BTC price analysis chart shows a bullish trend outlook. Meaning; that the base crypto relatively possesses the trending capability more than the counter crypto. The 14-day SMA trend line is above the 50-day SMA trend line as the bullish trend line is drawn between them in a supportive posture to the smaller SMA. The Stochastic Oscillators have traveled southbound to touch the range of 20. Ethereum may still go down a bit further as paired with Bitcoin. But, there is also an indication that the base crypto will in no time regain its strength.
Looking to buy or trade Ethereum (ETH) now? Invest at eToro!
67% of retail investor accounts lose money when trading CFDs with this provider.
Read more:
Join Our Telegram channel to stay up to date on breaking news coverage