Join Our Telegram channel to stay up to date on breaking news coverage
Market Converges at $3,500 – October 13
It is a couple of trading days’ sessions the ETH/USD market converges around $3,500. The market now trades at a $3,463 value line at a smaller negative percentage rate of 0.82. It also appears that the crypto economy is striving to hold back its position against the US economic trading situation.
Market Converges at $3,500: ETH Market
Key Levels:
Resistance levels: $3,750, $4,250, $4,500
Support levels: $3,000, $2, 750, $2,500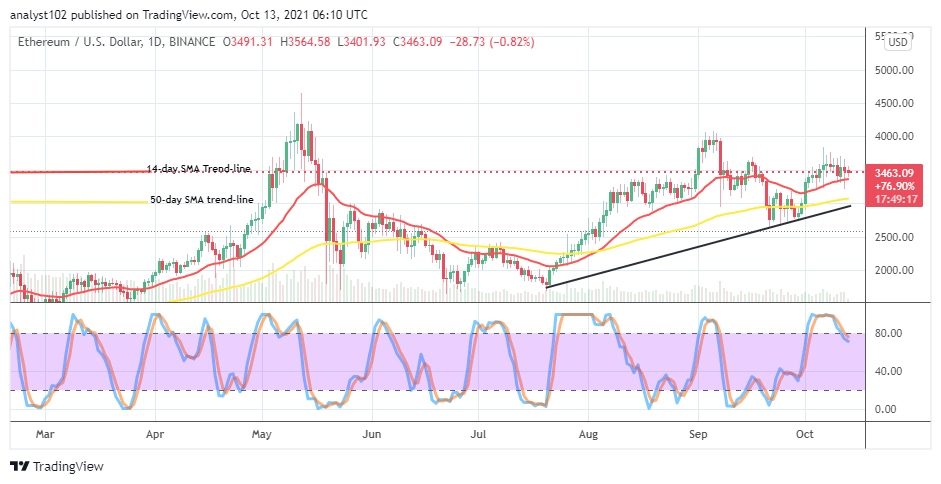
ETH/USD – Daily Chart
The ETH/USD daily chart showcases that the crypto-economic market converges around the level of $3,500. Variant top and bottom shadow candlesticks have been around the trading zone, causing a slight indecision trading moment. The 50-day SMA indicator is underneath the 14-day SMA indicator as the bullish trend line drew below them to touch a support level at $3,000. The Stochastic Oscillators have briefly bent southward from the overbought region against the range line at 80. That portends that the market moves relatively succumb to depression.
Will there be an end to the ETH/USD current trading condition soon as the market converges at $3,500?
The trading value line at $3,500 appears to be the mid-point between $4,000 and $3,000 lines as the ETH/USD market converges within those points. Lower time frames such as 4-hour and 1-hour will be good instrumental tools to determine the timely returning of a particular trade entry. The two different charts usually give decent buying entries while a candlestick suddenly spikes from lower trading zones.
On the downside, using the two different time frames will equally be instrumental to getting entries for shorting orders of this crypto market while a candlestick forms at a higher resistance trading line. If a sudden abnormal breakout against the stated resistance levels above occurs, there will be a reversal in no time to trail the presumed scenario.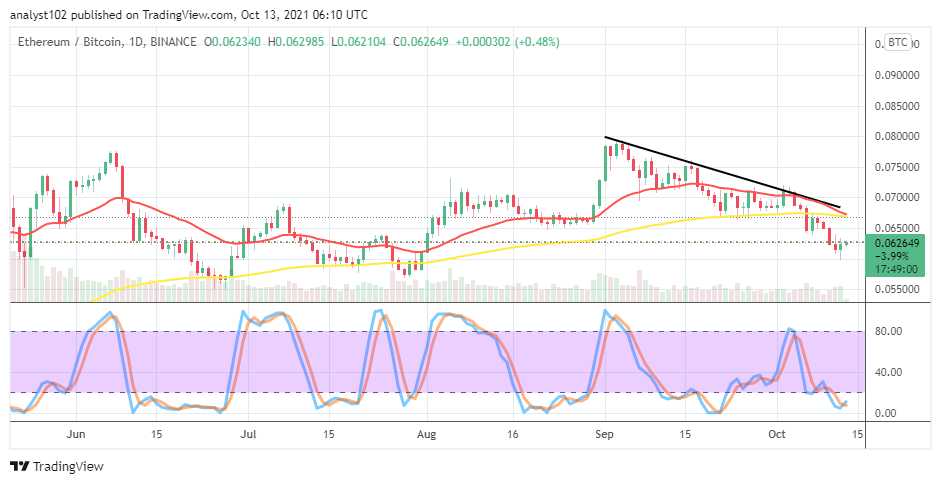
ETH/BTC Price Analysis
In comparison, Ethereum market operation versus Bitcoin’s on the price analysis chart shows that the base crypto is under pressure as paired with the flagship counter crypto. The 14-day SMA indicator has closely bent above the 50-day SMA indicator. And the bearish trend line drew closely at the extreme end of the smaller SMA trend line. The Stochastic Oscillators are in the oversold region, trying to cross the lines northbound. That signifies the possibility that the base crypto may soon regain the market strength against the counter crypto.
Looking to buy or trade Ethereum (ETH) now? Invest at eToro!
67% of retail investor accounts lose money when trading CFDs with this provider.
Read more:
Join Our Telegram channel to stay up to date on breaking news coverage