Join Our Telegram channel to stay up to date on breaking news coverage
ETH Price Prediction – January 22
The bullish trend is on hold for now amidst major correction and if Ethereum (ETH) reclaims $180, buyers are likely to gain more control.
ETH/USD Market
Key Levels:
Resistance levels: $185, $190, $195
Support levels: $150, $145, $140
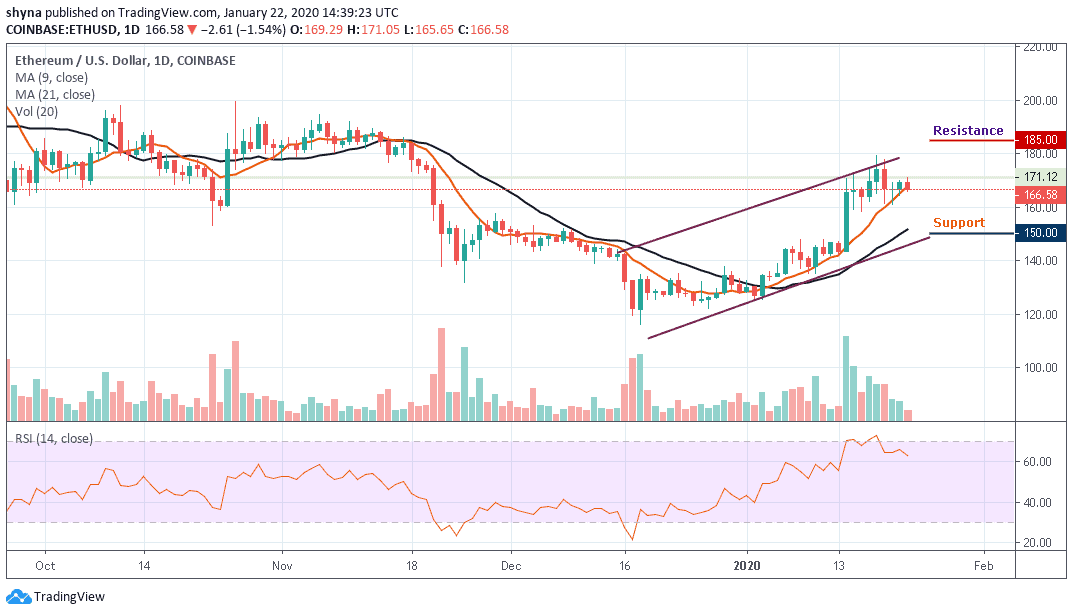
As the market opens today, ETH/USD makes a quick turn from $169 level after an unsuccessful attempt to settle below $166 where the coin is currently changing hands, down 1.5% on a daily basis and since the beginning of the day. The bulls have so far been hit by the rejection of the main barrier at $171, heading towards the 9-day moving average.
Looking at the daily chart, the initial support is created below the 9-day moving average at $165. Once this is eliminated, the sell-off may increase with the next focus on the $160 level. If this support level drops, the downward momentum could begin to snowball and the next downside target to $155. ETH/USD is powered by the lower line of the channel and the closest supports to watch are $150, $145 and potentially $140.
On the upside, the recovery is limited by the moving average on the daily chart at $170. However, the bulls must realize the need to clear the $175 level before they can get to the upper side of the channel and reach the intraday high of $180. Above this handle, we will need to consider a sustained move for the extended recovery to the resistance levels at $185, $190 and $195. Meanwhile, the RSI (14) has fallen sharply from the 65-level due to the current downtrend in the market.
Against Bitcoin, Ethereum has remained in a downward range since the last year 2019. However, it has witnessed a nice increase since the beginning of the year 2020. From 0.017 SAT low, the cryptocurrency is trading as high as 0.0192 SAT as of the time of writing. If the bulls managed to break the three-month channel to reclaim the 0.0200 SAT level, we could see ETH charging at 0.0205 SAT and 0.0210 SAT resistance levels.
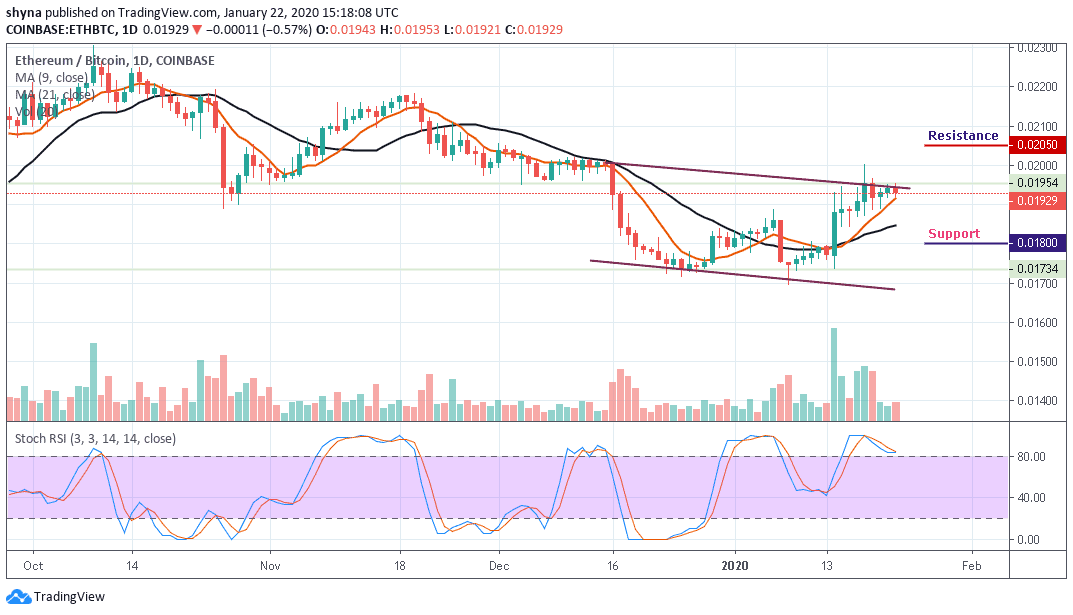
However, the buyers are still trapped in a bearish zone. We can expect more gains as soon as a price break occurs at 0.020 SAT. Otherwise, Ethereum is most likely to resume its long-term bearish scenario. However, a continuous drive lower could keep ETH price at the 0.0180 SAT support and beyond.
Please note: Insidebitcoins.com is not a financial advisor. Do your research before investing your funds in any financial asset or presented product or event. We are not responsible for your investing results.
Join Our Telegram channel to stay up to date on breaking news coverage