Join Our Telegram channel to stay up to date on breaking news coverage
The ETH/USD bears run in two consecutive sessions in the red, while the bulls lose momentum.
ETH/USD Market
Key Levels:
Resistance levels: $155, $157, $159
Support levels: $131, $129, $127
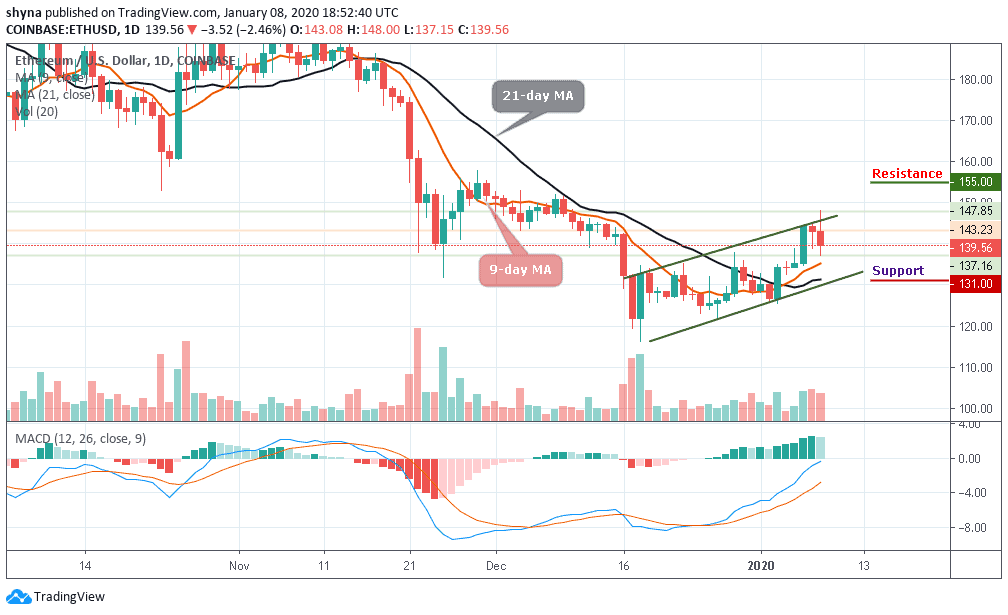
The price of Ethereum is trying to break the $148 level, gradually gaining to maintain its movement. More so, ETH/USD was above the newly formed major resistance level of $145 a couple of days ago. The price of the Ethereum dropped significantly today after touching the $147.85 resistance level. ETH/USD now faces the south trading around $139.56 but still above the 9-day and 21-day moving average.
For now, the Ethereum (ETH) is following the upward trend within the ascending channel and currently, in its price correction phase, it is attempting to take progressive steps to combat the loss. However, the coin may reach the resistance levels of $131, $129 and $127 before the end of the week if the bulls make more effort.
In other words, if the bulls fail, the coin price will remain low as it will still evolve under the moving averages of 9-day and 21-day with the nearest support levels at $131, $129 and $ 127 respectively. The MACD signal lines are making an attempt to move from the negative side to the positive side.
ETH/BTC Market
Ethereum has continued to follow a bearish sentiment and has already moved below the 9-day and 21-day moving averages, as the token suffers from strong selling power. Even if the bulls are trying to gain momentum, the bears may continue to release huge pressure on the market. At the time of writing, Ethereum was trading near 1732 SAT which is very close to its all-time low.
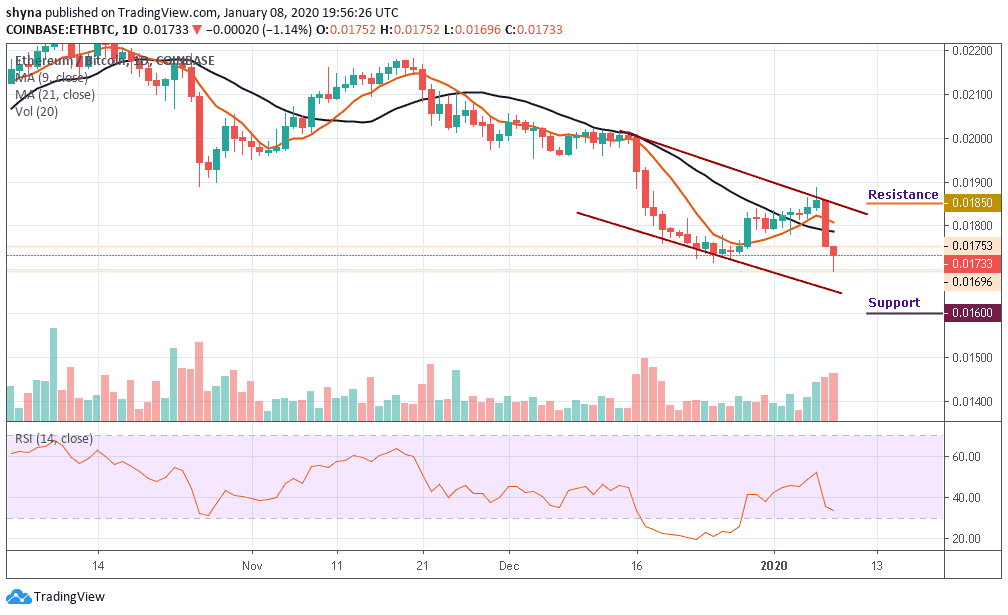
However, the bearish scenario might rally further to 1600 SAT and 1550 SAT support levels. Currently, the Ethereum price is moving below the 40-level of the daily RSI (14). If the bulls could manage to find support at this level, an upward movement to the 1850 SAT and potentially 1900 SAT resistance levels may likely surface. But a glance at the current market suggests a dominant downward trend for the ETH/BTC market.
Please note: Insidebitcoins.com is not a financial advisor. Do your research before investing your funds in any financial asset or presented product or event. We are not responsible for your investing results.
Join Our Telegram channel to stay up to date on breaking news coverage