Join Our Telegram channel to stay up to date on breaking news coverage
Ethereum Price Prediction – February 1
The Ethereum price prediction may likely set a bullish run if the market can climb back above the $3000 resistance level.
ETH/USD Market
Key Levels:
Resistance levels: $3200, $3400, $3600
Support levels: $2300, $2100, $1900

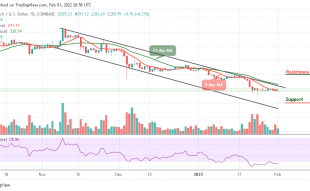
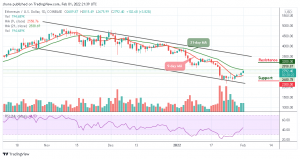
ETH/USD is trading within a positive movement at the time of writing. The market is running a little retracement move towards $3000 resistance with a price growth of 4.53%. However, Ethereum (ETH) is beginning to maintain a bullish movement within the channel and traders can expect the price to continue to rise as soon as the bulls put more pressure on the market.
Ethereum Price Prediction: Would ETH Price Break to the Upside?
If the lower boundary breaks again, the Ethereum price may slide back to $2500 and $2400 support. Moreover, if the price keeps respecting the upward movement, traders can then expect a bullish continuation after touching the $2800 level. As the technical indicator Relative Strength Index (14) faces the north above 40-level, the next resistance levels could be located at $3200, $3400, and $3600 respectively.
However, looking at the price formation, a bearish break below the 9-day moving average may likely play out for this market if the bears step into the market. More so, a bearish extension could roll the coin back to the long-term support levels at $2300, $2100, and $1900. Therefore, a continuous fall might further lead to a violent break below $1700.
When compares with Bitcoin, buyers are about stepping back into the market while the coin is trying to show some promising signs that could make higher highs should it keep on moving above the 9-day and 21-day moving averages. Looking at from the upside, the nearest resistance level lies at 7500 SAT as higher resistance lies at 7700 SAT and above.
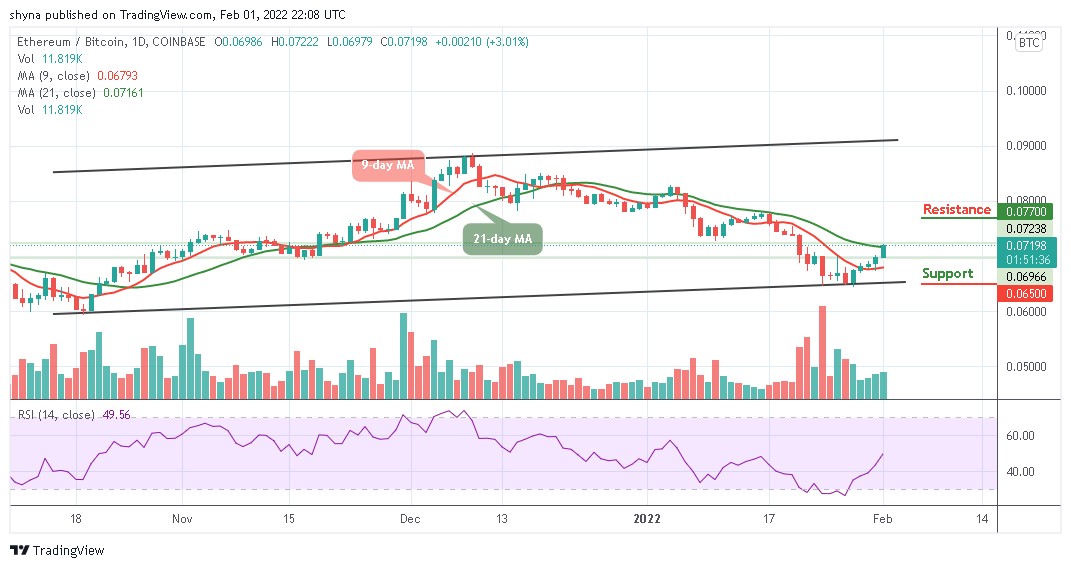
Meanwhile, from the downside, the nearest support level is located at 6800 SAT and if the price drops further to create a new low, lower support could be located at 6500 SAT and below. More so, the technical indicator Relative Strength Index (14) facing to cross above 50-level which shows that the bulls are coming into focus.
Looking to buy or trade Ethereum (ETH) now? Invest at eToro!
68% of retail investor accounts lose money when trading CFDs with this provider
Join Our Telegram channel to stay up to date on breaking news coverage