Join Our Telegram channel to stay up to date on breaking news coverage
ETH Price Prediction – December 26
ETH/USD must break and close back above the $130 price mark, for further upside.
ETH/USD Market
Key Levels:
Resistance levels: $140, $150, $160
Support levels: $110, $100, $90
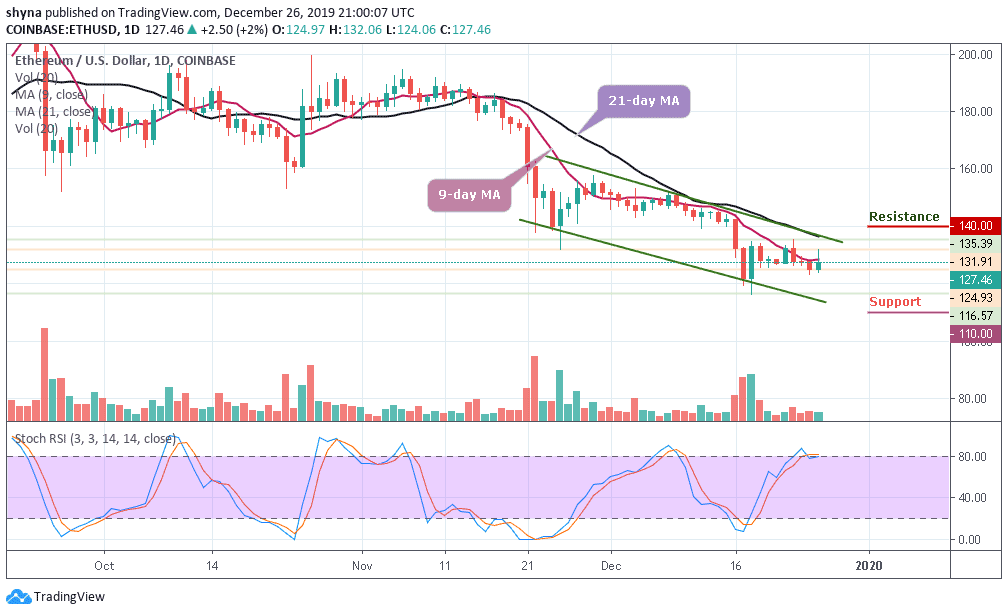
Today has been a good time for Ethereum holders as the coin is starting to show a sign of improvement and it may likely begin to trade above $130 very soon. The current performance of ETH/USD in the market also indicates the beginning of an uptrend before the end of this week as the stochastic RSI is about entering into the overbought zone, and traders must therefore closely monitor this coin.
Similarly, the highest value Ethereum has had within the last 10 days was $135 and it has gone down to $116 within the same period. ETH/USD can be expected to rise from $130 to $135 over the next one week while the on-going trend may move a little bit higher this week, and the coin could cross above the 9-day and 21-day MAs to touch the nearest resistance at $140, if the bulls put more effort, the price could hit additional resistance levels at $150 and $160 respectively.
Meanwhile, should the technical indicator decide to make a quick turn to the south, there may be a continuation of a downward trend and the bearish drop may likely roll the market down to $110, $100 and $90 support levels.
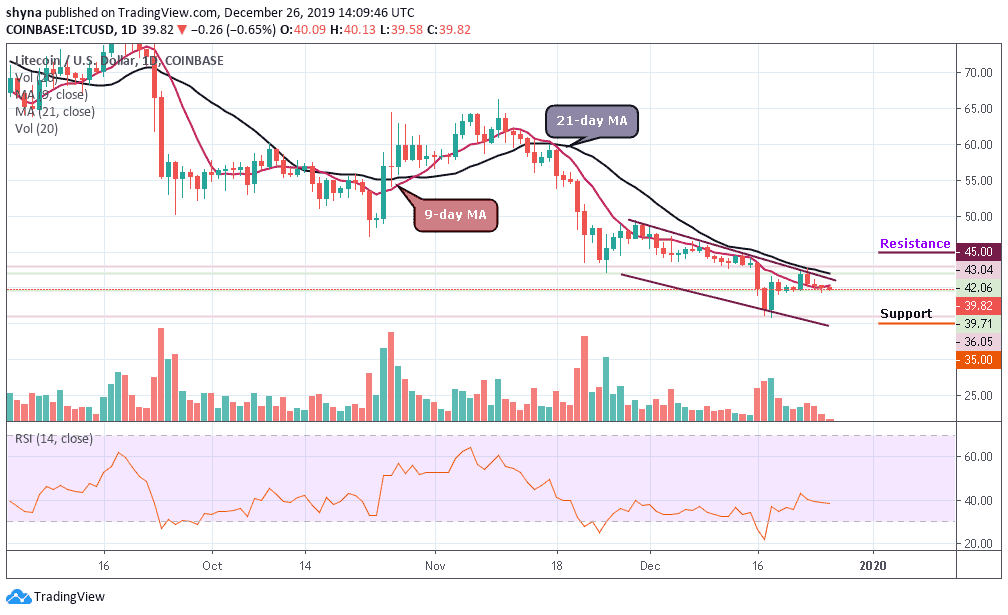
Against Bitcoin, Ethereum (ETH) is currently changing hands at 1754 SAT after witnessing some heavy bearish moment in the last few days. Looking at the daily chart, the current trend of the coin is perpetually still looking bearish in the short-term, but the bulls are pushing the price towards the 9-day MA within the descending channel.
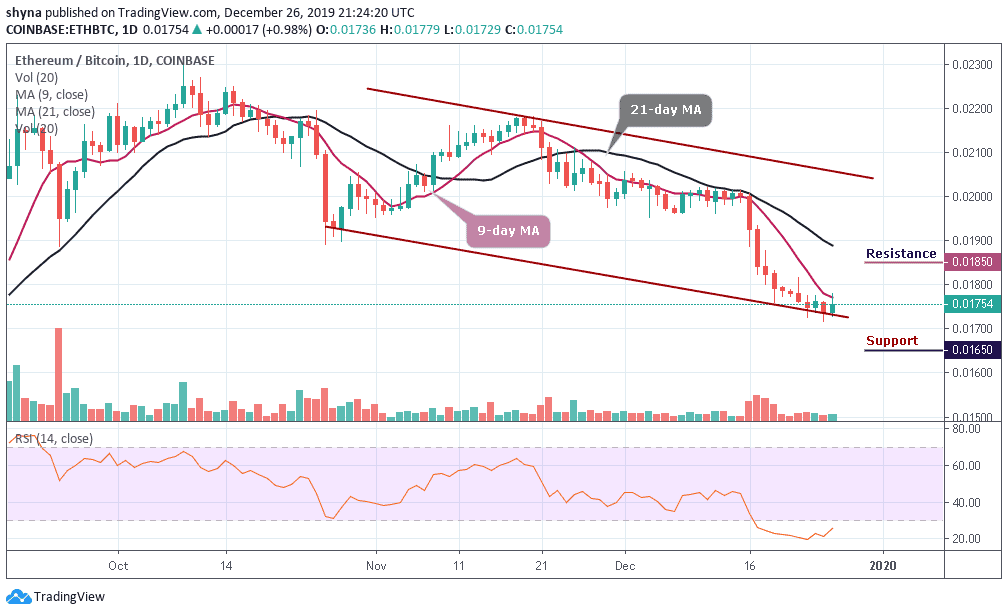
Meanwhile, the resistance levels to look for are 1850 SAT and 1900 SAT while the closest support levels to keep an eye on are 1650 SAT and potentially 1600 SAT. The RSI (14) moves within the oversold territory, which may likely give more bearish signals as long as it remains there.
Please note: Insidebitcoins.com is not a financial advisor. Do your research before investing your funds in any financial asset or presented product or event. We are not responsible for your investing results.
Join Our Telegram channel to stay up to date on breaking news coverage