Join Our Telegram channel to stay up to date on breaking news coverage
ETH Price Prediction – February 2
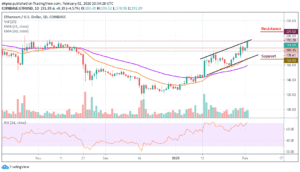
ETH/USD started today on a negative note but a sustainable move above $195 will improve the technical picture.
ETH/USD Market
Key Levels:
Resistance levels: $205, $210, $215
Support levels: $168, $163, $158

ETH/USD has tested $185 during early Asian hours after which it went down and touched the $178.61 level but later managed to recover above $190 at the time of writing. The price of Ethereum (ETH) with the current market value of $191.89 has stayed unchanged on a day-to-day basis and gained nearly 4.57% since the coin rebounded amid the recovery across the cryptocurrency markets.
However, the Ethereum price has continued to rise further higher until it finds resistance at the expected level of $195. Looking at the daily chart, we can see that ETH/USD even spiked higher into the resistance level at $193.38. Therefore, if the buyers continue to push the market higher, the immediate resistance above the $200 level will be located. Above this, further resistance levels lie at $205, $210 and $215.
Alternatively, if the bears step back into the market to bring down the price below the channel, also to near the orange-line of 21 periods EMA, the bears can expect immediate support to be located at $170 which is below the trend line of the channel. Below $170, further support is found at $168, $163 and $158 levels. Meanwhile, the RSI (14) crosses into the overbought zone, which signals a more bullish movement.
Against BTC, Ethereum is still trading above the 21 periods and 50 periods EMA within the ascending channel and the price is now hovering at 2033 SAT as the RSI (14) faces the overbought zone. Although the bulls remain the dominant of the market, the pair seems to break the upper boundary of the channel.
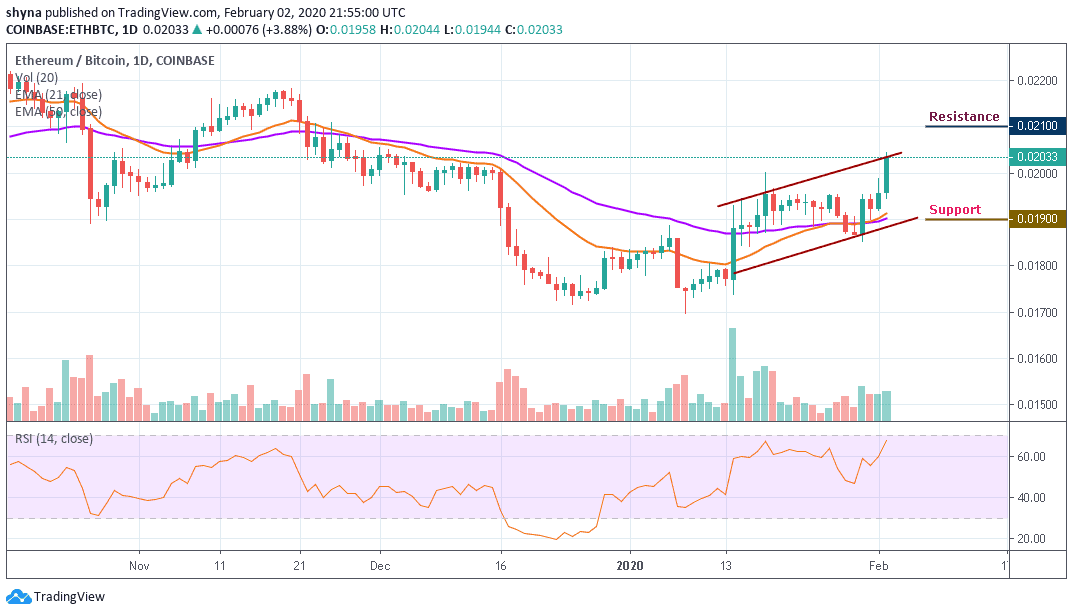
At the upside, the resistance levels to be reached are 2100 SAT and 2150 SAT. Conversely, a lower sustainable move may likely cancel the bullish pattern and this could attract new sellers to the market with the next focus on 1900 SAT and 1850 SAT support levels.
Please note: Insidebitcoins.com is not a financial advisor. Do your research before investing your funds in any financial asset or presented product or event. We are not responsible for your investing results.
Join Our Telegram channel to stay up to date on breaking news coverage