Join Our Telegram channel to stay up to date on breaking news coverage
Downsizes Points in Ranges – July 11
The trading operation between Ethereum and the US Dollar downsizes points in the ranges of $2,500 and $2,000. The crypto trades around $2,093 at a negative rate of 0.87 percentages as of writing.
Downsizes Points in Ranges: ETH Market
Key Levels:
Resistance levels: $2,500, $3,000, $3,500
Support levels: $1,800, $1,600, $1,400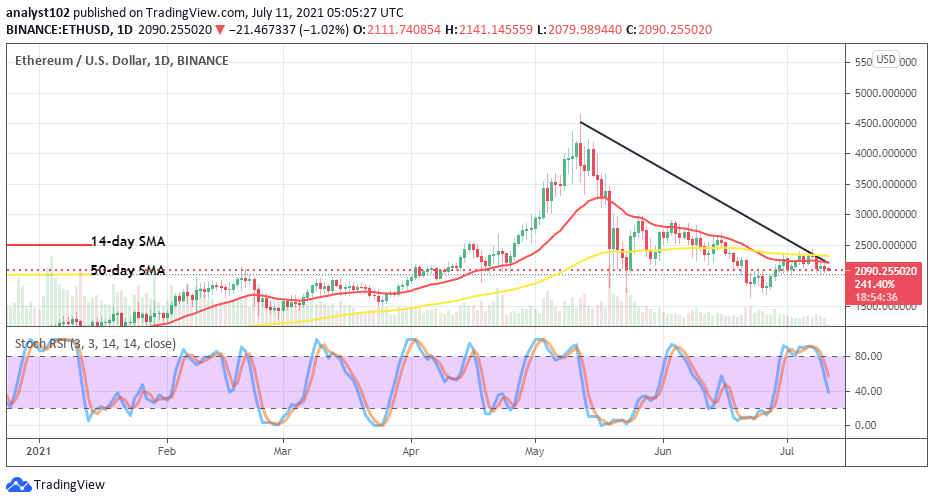
ETH/USD – Daily Chart
The ETH/USD daily chart showcases that the crypto market’s worth downsizes points in ranges that also embodied the trading indicators. A very tiny smaller-bearish candlestick features close to the lower range level of $2,000. The 50-day SMA indicator is above the 14-day SMA trend-line, as they both point toward the east direction at the middle of the current range-bound trading zones to suggest that the crypto market is undergoing a sideway moving trend. The Stochastic Oscillators have swerved southbound from the overbought region to touch the range of 40. The market seems to get a pause as it downsizes around the lower range level in the near session.
Will there be a change in the crypto trade’s direction soon, as ETH/USD downsizes points in ranges?
During the July 8th day trading session, a bearish candlestick emerged to efface some efforts that the ETH/USD market bulls made to attempt trading past the bigger SMA in the range-bound trading zones. As a result, the crypto’s price now downsizes points toward the smaller range line. A further visible southward push against the lower range line coupled with a rebound will potentially give birth to getting a decent buy entry.
Analyzing the downside of this crypto economy, the pressure needed to mount upon the present market’s value a bit above the $2,000 to get a push down past it. The readings of Stochastic Oscillators are yet relatively back to it that the movement to the downside is imminent. Therefore, traders needed to look out for a reliable active falling force before considering a sell entry around the lower range line.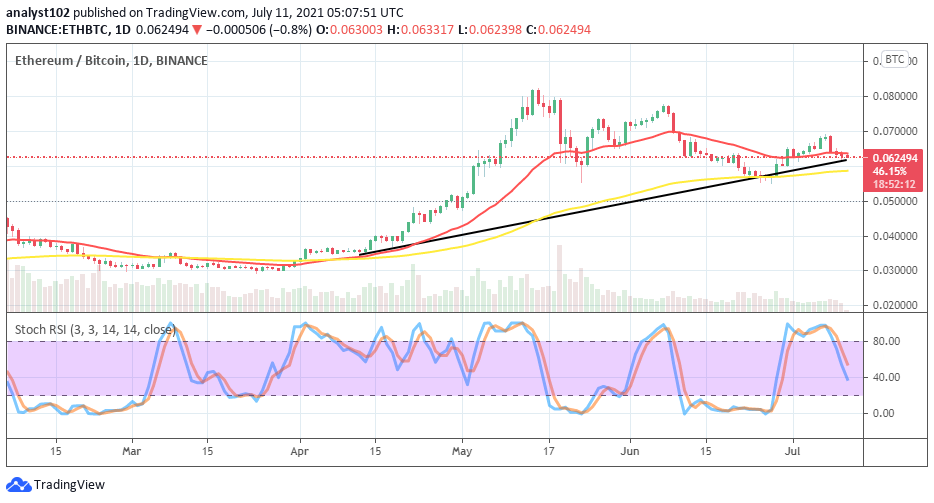
ETH/BTC Price Analysis
The trending capability between Ethereum and Bitcoin on the price analysis chart shows that the base crypto downsizes points against its counter crypto. The bullish trend-line drew in between the small space of the SMAs as the 14-day SMA trend-line is above the 50-day SMA indicator, somewhat pointing to the north to indicate that the base instrument may in no time regain its momentum to push against the counter tool. The Stochastic Oscillators have crossed the lines southbound, reaching for the range of 40. That suggests that Ethereum may some extent go downsizing as paired with Bitcoin in the next session.
Looking to buy or trade Ethereum (ETH) now? Invest at eToro!
75% of retail investor accounts lose money when trading CFDs with this provider
Join Our Telegram channel to stay up to date on breaking news coverage