Join Our Telegram channel to stay up to date on breaking news coverage
Ethereum Price Prediction – January 13
The Ethereum price prediction is approaching a crucial support level which could take the coin to the downside.
ETH/USD Market
Key Levels:
Resistance levels: $3600, $3700, $3800
Support levels: $3000, $2900, $2800
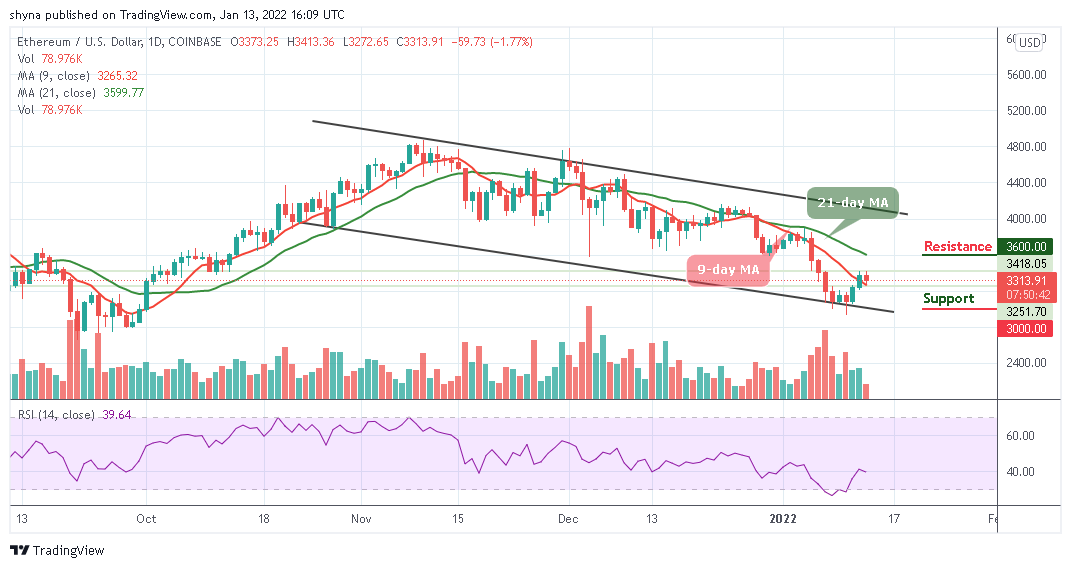
According to the daily chart, ETH/USD is currently trading down by 1.77% at its current price of $3313.91, which marks a notable decline from its daily high of $3413 when the coin experiences a slightly positive move. In the past few hours, ETH/USD has not been above to fall below the 9-day moving average.
Ethereum Price Prediction: Ethereum Price May Face More Corrections
After touching the daily high of $3413 during the European session today, the Ethereum price is currently heading to the downside. Meanwhile, it is likely for the coin to face more corrections as the 9-day moving average remains below the 21-day moving average. However, the Ethereum price movement is bearish while all the technical indicators stay within the negative side.
In the meantime, a bearish drop below the lower boundary of the channel may roll the market down to the support level of $3000, $2900, and $2800 while a possible bullish surge could drive the market towards the channel to hit the nearest resistance levels of $3600, $3700, and $3800 which could further provide bullish signals for the market. Meanwhile, the Relative Strength Index (14) is seen crossing below 40-level and staying there may cause the coin to create another low.
Against Bitcoin, the Ethereum price is currently facing the downside as the bulls are yet to take over the market. As it is, ETH/BTC is currently trading at 7639 SAT and the bulls couldn’t push the price above the 9-day moving average. However, if the market drops below the lower boundary of the channel, the next key supports may likely come at 7000 SAT and below.
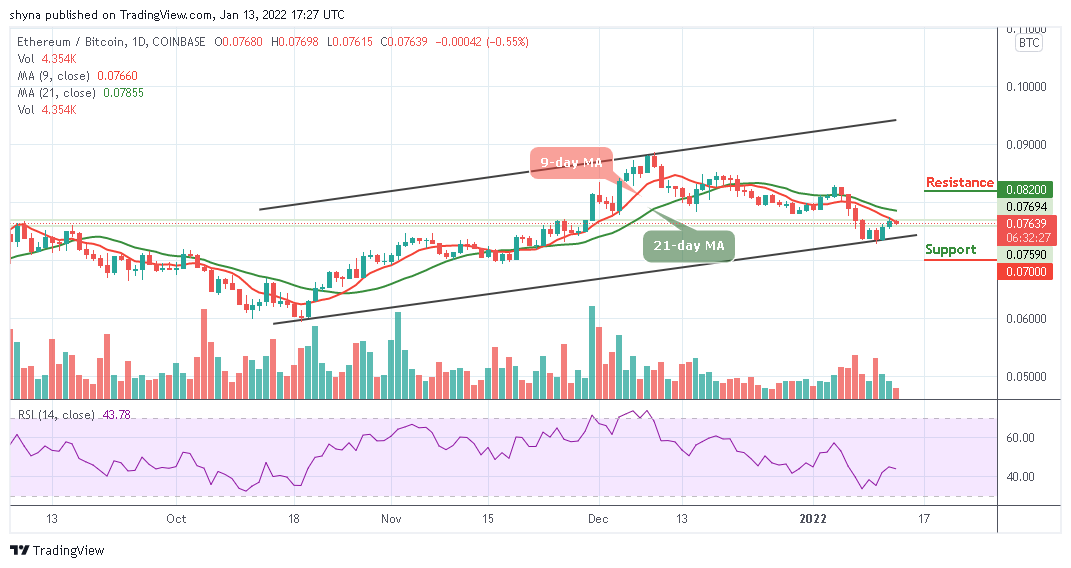
On the upside, any bullish movement above the 9-day and 21-day moving averages could push the market towards the positive in other to visit the resistance level of 8200 SAT and above. Similarly, the Relative Strength Index (14) is moving below 50-level, suggesting that the market may follow bearish movement.
Looking to buy or trade Ethereum (ETH) now? Invest at eToro!
68% of retail investor accounts lose money when trading CFDs with this provider
Join Our Telegram channel to stay up to date on breaking news coverage