Join Our Telegram channel to stay up to date on breaking news coverage
Ethereum Price Prediction – August 1
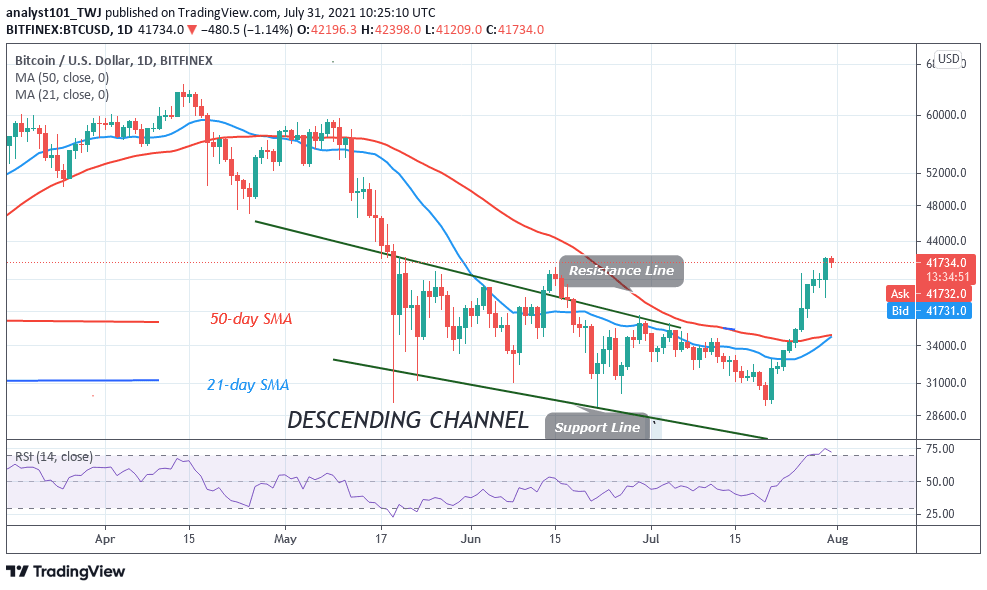
The Ethereum price prediction is seen breaking above the $2600 resistance level as the coin eyes are glued on $2700.
ETH/USD Market
Key Levels:
Resistance levels: $3000, $3100, $3200
Support levels: $2300, $2200, $2100
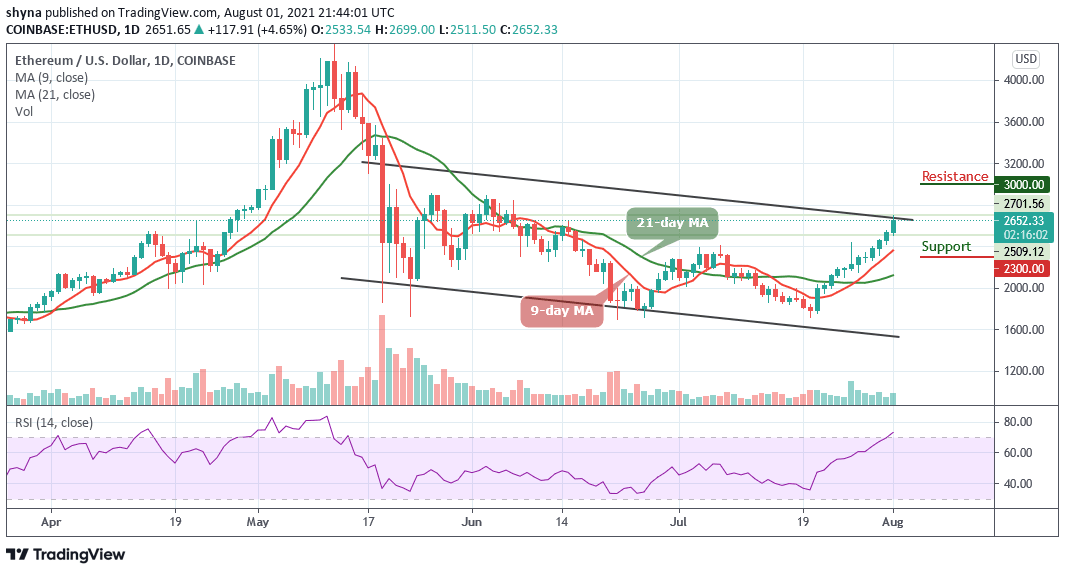
ETH/USD is seen refreshing to a new high after touching the daily low of $2511 to breaches above $2600 while currently trading at $2652 with a bullish crossover above the upper boundary of the channel. On the contrary, the bears may attempt to increase selling pressure but the bulls may collect more on the price dips.
Ethereum Price Prediction: Ethereum Price May Continue to Push Higher
The Ethereum price can only maintain the uptrend if the $2600 subsidy is maintained at all costs. Currently, the technical indicator Relative Strength index (14) is crossing into the overbought region by sending more bullish signals into the market which can finally encourage more buyers to enter the market. However, the Ethereum (ETH) is now making an attempt to maintain a bullish trend above the channel.
Meanwhile, in as much as the red-line of 9-day MA remains above the green-line of 21-day MA, the coin may continue to do well and the Ethereum price can hit the resistance levels at $3000, $3100, and $3200 respectively. More so, if the technical indicator decides to make a quick turn back below the upper boundary of the channel, then, there may be a quick bearish drop which may likely roll the market down to the support levels of $2300, $2200, and $2100 respectively.
When compares with Bitcoin, Ethereum is trading above the 9-day and 21-day moving averages as the price hovers at 6470 SAT. Meanwhile, the technical indicator Relative Strength Index (14) is moving above 55-level. Moreover, for the fact that the market price remains at the upside, the pair seems to be moving to cross above the upper boundary of the channel.
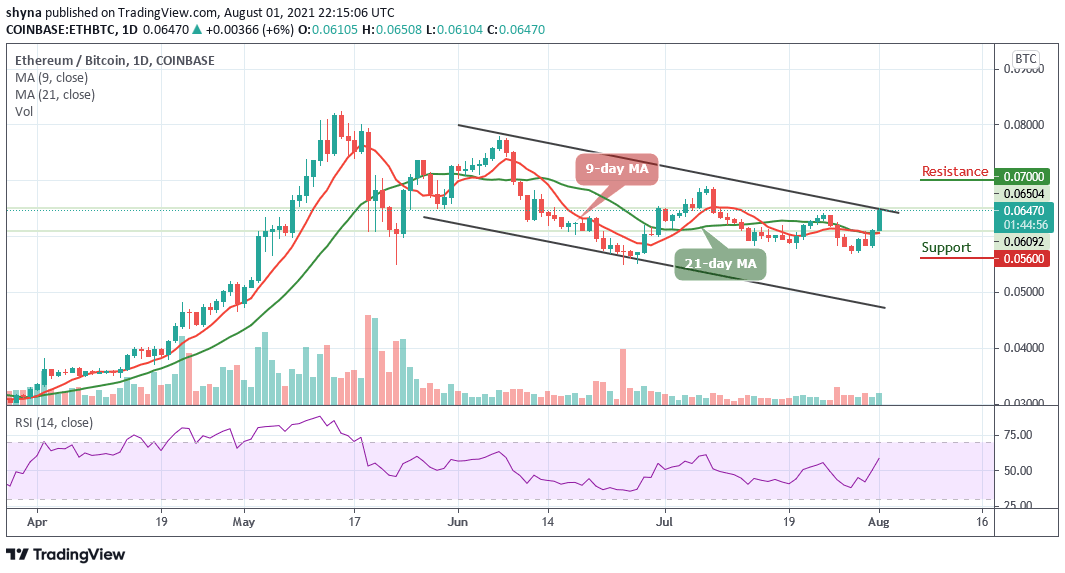
Moreover, the daily chart reveals that the potential resistance level is located at 7000 SAT and above but a lower sustainable move may likely cancel the bullish pattern which could attract new sellers coming into the market with the next focus on the support level of 5600 SAT and below.
Looking to buy or trade Ethereum (ETH) now? Invest at eToro!
75% of retail investor accounts lose money when trading CFDs with this provider
Join Our Telegram channel to stay up to date on breaking news coverage