


Join Our Telegram channel to stay up to date on breaking news coverage
Ethereum (ETH) Price Prediction – September 19
Ethereum bulls’ main focus depended upon the breaking of the resistance level. ETH/USD is trading at $385 at the time of writing. On the ETH/BTC chart, the market was previously in a sideways trend. Today, the coin is trending as it resumes the uptrend.
ETH/USD Market
Key Levels:
Resistance Levels: $200, $220, $240
Support Levels: $160, $140, $120
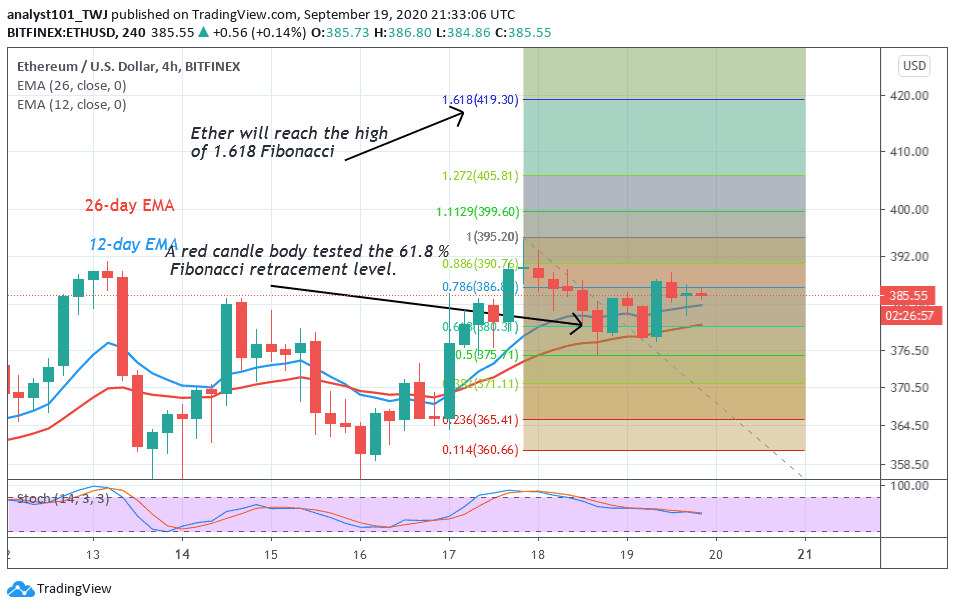
Since September 13, buyers have been making frantic efforts to break the $390 resistance. About four attempts have been made to break the resistance but to no avail. Nonetheless, a strong bounce above the $380 support could have broken the resistance at $390. Eventually, if buyers are successful, the market will rise to $420 high. On the downside, if the price breaks below $380, the selling pressure will resume. On September 17 uptrend, the coin was resisted at $390. The retraced candle body tested the 61.8% Fibonacci retracement level. It indicates that ETH will rise and reach 1.618 Fibonacci extension level or $420 high. The market is fluctuating below the resistance.
Ethereum Indicator Analysis
The price is above the EMAs which suggests an upward movement of the coin. Besides, the uptrend will continue as long as the price is above the EMAs. ETH is in a bearish momentum as it is below the 50% range of the daily stochastic.
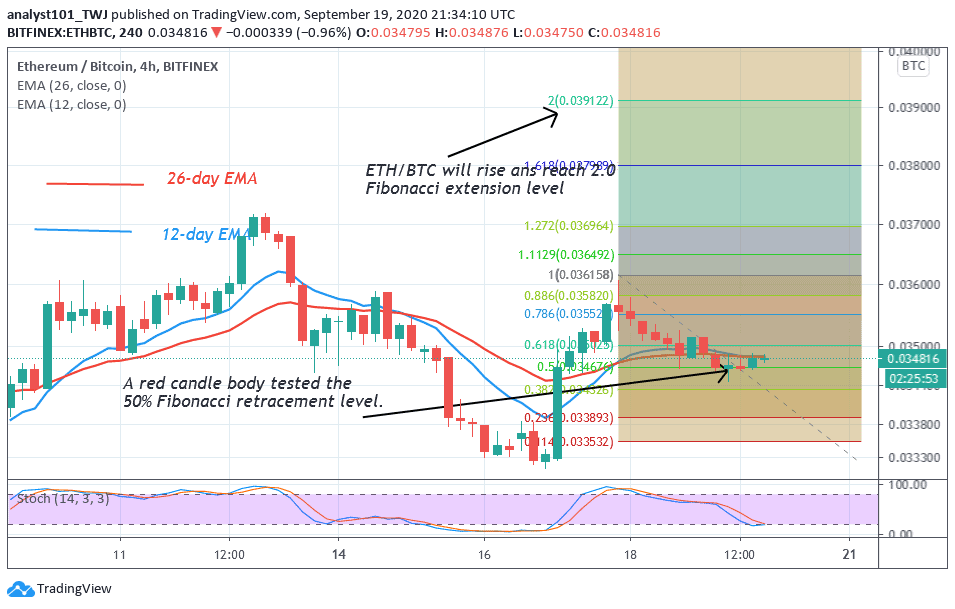
Nonetheless, in the ETH/BTC, the coin was earlier in a sideways move. It has resumed an upward move. On the September 17 uptrend, the market reached a high of Ƀ0.035690. The red retraced candle body tested the 50% Fibonacci retracement level. This suggests that the market will rise and reach the 2.0 Fibonacci extension level. That is the high of Ƀ0.039000. The crypto is at level 48 of the Relative Strength Index period 14. It indicates that the market is in the downtrend zone and below the centerline 50.
Join Our Telegram channel to stay up to date on breaking news coverage
