Join Our Telegram channel to stay up to date on breaking news coverage
DASH Price Analysis – June 8
A bullish channel pattern has been shading the price action for five days, while the cryptocurrency continues to respect the formation of the channel. In case of channel breakdown, we can expect a new wave for the market; maintaining a bullish continuation pattern or a bearish reversal pattern. Anyway, DASH/USD is bearish in the short term. The medium-term remains ranging.
DASH/USD Market
Key Levels:
Supply levels: $220, $230 $240
Demand levels: $80, $70, $60

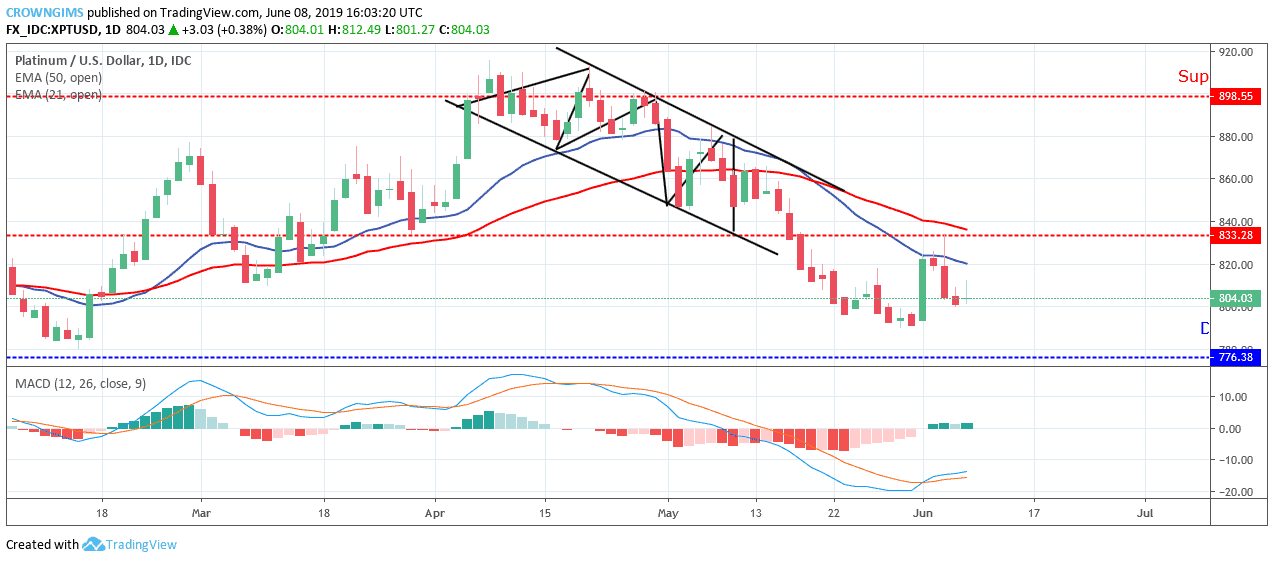
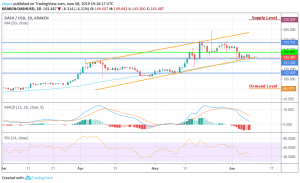
Today, DASH/USD has returned to test the lower channel after the massive sale that currently stands at $143.5. The bears have reached a solid level, which could lead to a rebound or break. Meanwhile, the MACD indicator has actually fallen in the bearish zone after a positive two-week movement in the market.
In addition, the medium-term RSI is now moving below level 50, which could fall into the oversold territory; the bearish movement of the previous five days, which has significantly led to trade with the lower channel. If the DASH/USD pair is broken, we can expect an immediate demand of $80, $70 and $60 respectively. On the other hand, a rebound could gather buyers for a key level of around $220, $230 and $240. Given the current market situation, the currency follows the trend line at this time.
DASH/BTC Market
For more than two days, the DASH/BTC market has experienced a significant fall in prices, with a strong rejection of the price at 0.018657BTC, which has reduced the coin to a current price of around 0.018334BTC. In a gradual decline, sellers approach demand close to 0.01288 BTC. The market is still moving under the blue line of the MA 50 and is about to cross the lower channel of the symmetrical triangle.
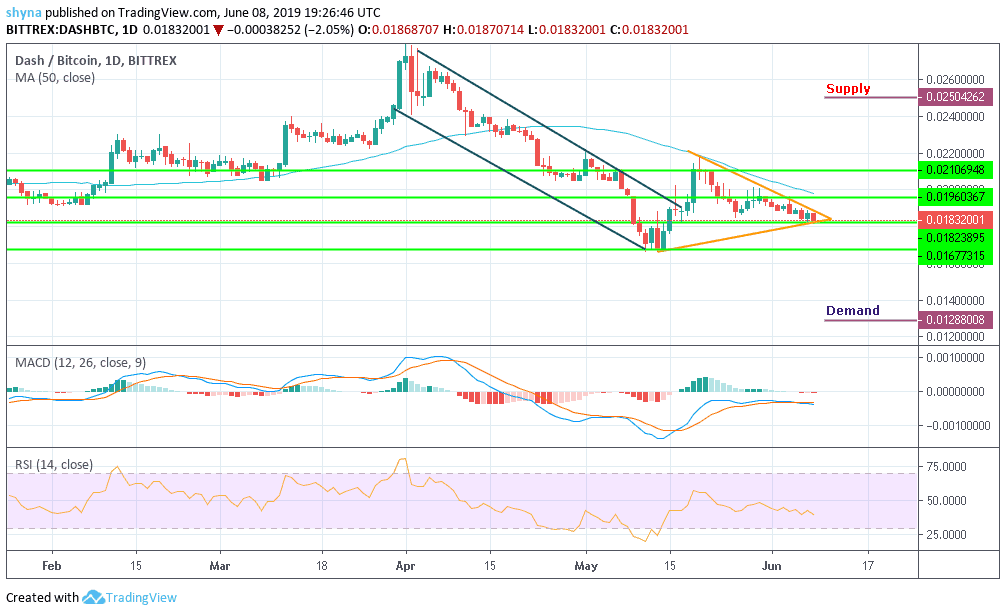
On the positive side, DASH faces a supply of 0.025BTC. Above the resistance is the main supply at 0.027BTC. The cryptocurrency has experienced significant support at the zero levels of the MACD indicator. If the signal falls below the zero levels, we can expect a downward pressure below the channel. However, the RSI has already fallen below level 50, since it is currently moving in the opposite direction, showing an undecided direction.
Please note: insidebitcoins.com is not a financial advisor. Do your own research before investing your funds in any financial asset or presented product or event. We are not responsible for your investing results.
Join Our Telegram channel to stay up to date on breaking news coverage