Join Our Telegram channel to stay up to date on breaking news coverage
Key Points Bitcoin price found support near $7,260 and bounced back above $7,400 against the US Dollar. The BTC/USD pair is currently attempting a close above a crucial bearish trend line with resistance at $7,650 on the hourly chart (data feed from Kraken). A successful close above the trend line and $7,700 may perhaps open the doors for more gains.
Bitcoin price is showing positive signs above $7,400 against the US Dollar. BTC/USD must break the $7,650 and $7,700 resistance levels to recover further.
Bitcoin Price Analysis
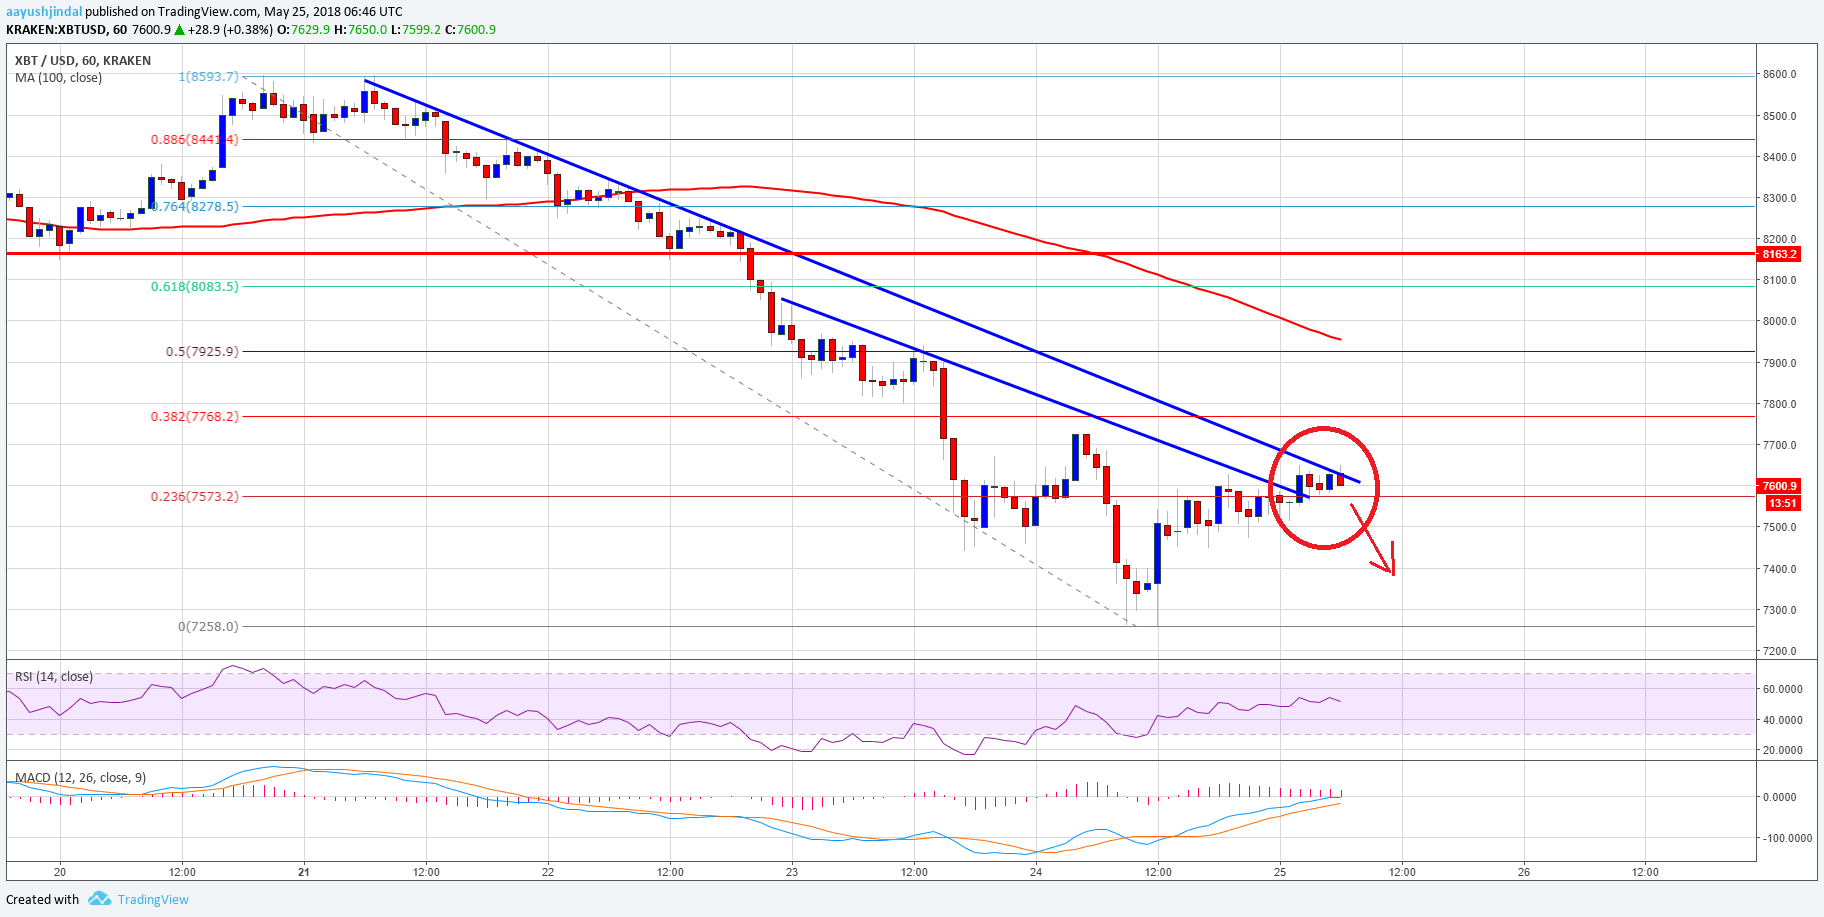
There were further bearish moves below $7,500 in bitcoin price against the US Dollar. The BTC/USD pair traded close to the $7,200 support level before buyers appeared. A low was formed at $7,258 from where the price started an upside correction. Buyers succeeded in pushing the price back above the $7,400 resistance, which is a positive sign.
During the recent upside move, the price also crawled above the 23.6% Fib retracement level of the last drop from the $8,593 high to $7,258 low. More important, there was a break above a key connecting bearish trend line with resistance at $7,600 on the hourly chart of the BTC/USD pair. However, the pair is currently struggling to move above another bearish trend line with resistance near $7,650 on the same chart. A close above $7,650 and $7,700 is required for buyers to gain control. The next major hurdle is near $8,000 and the 50% Fib retracement level of the last drop from the $8,593 high to $7,258 low.
Looking at the chart, the price is forming a bullish pattern, but it won’t be easy the bulls to clear the $7,700 resistance. Should they fail to move the price above $7,700, BTC/USD could drop back towards the $7,300 and $7,200 in the near term.
Looking at the technical indicators:
Hourly MACD – The MACD for BTC/USD is back in the bullish zone.
Hourly RSI (Relative Strength Index) – The RSI is now well above the 50 level.
Major Support Level – $7,200
Major Resistance Level – $7,700
The post Bitcoin Price Watch: Can BTC/USD Break This? appeared first on NewsBTC.
Join Our Telegram channel to stay up to date on breaking news coverage