Join Our Telegram channel to stay up to date on breaking news coverage
Bitcoin (BTC) Price Prediction – October 6
The cryptocurrency market has remained gloomy since the massive decline of 24 September 2019.
BTC/USD Long-term Trend: Bearish (Daily Chart)
Key levels:
Resistance Levels: $9,000, $9,500 $10,000
Support Levels: $7,000, $6,500, $6,000
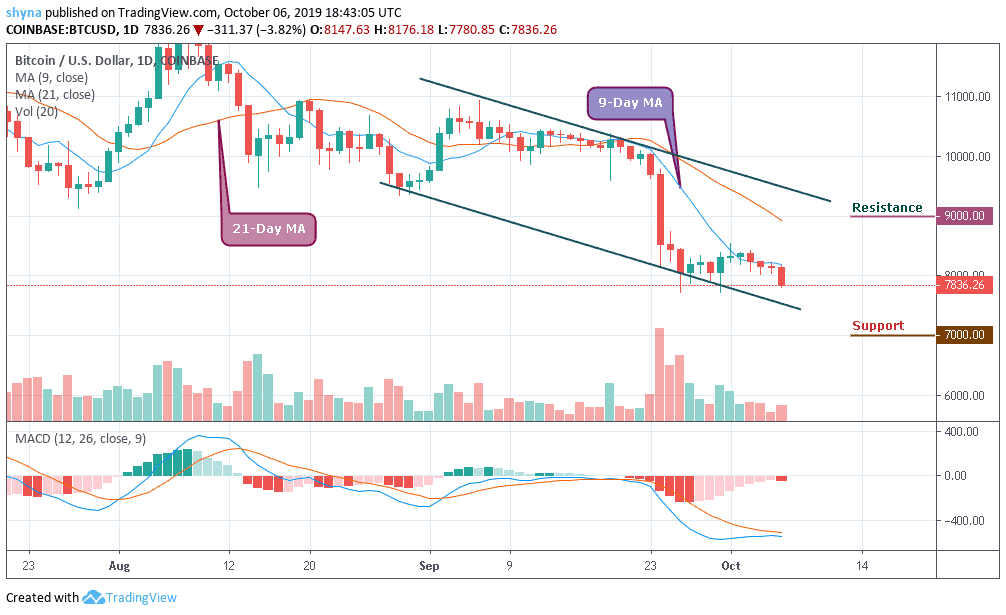
BTC/USD has been struggling to maintain its position above $8,000 and its price saw another dive below the $8k mark today. The coin is in a dangerous position as the price slipped below the critical support level of $8,000 during early Asian hours. If the breakthrough is confirmed, the downside momentum will gain traction with the next focus on $7,500. At the time of writing, Bitcoin was trading below the moving averages of 9-day and 21-day at $7,836.26 with a decline of 3.82% on the daily price chart.
Moreover, if we look at the price movement of BTC since the beginning of the year, we can see that the coin has registered a growth of over 100% in the past 9 months. BTC/USD started the year trading at $3,716.36 and reached $12,948.87 before starting the downward journey. In the last 90 days, the highest recorded price of BTC was $12,597 and the coin is capable of moving past this value in the upcoming months.
However, should BTC price failed to move up; we may see a price cut to $7,500 vital support. A further low drive could send the price to $7,000, $6,500 and $6,000 support levels while the resistance levels to watch are $9,000, $9,500 and $10,000. MACD indicator suggested a probable bullish crossover in the near future. This bullish crossover falls in line with the descending channel mentioned earlier.
BTC/USD Medium-Term Trend: Bearish (4H Chart)
Looking at the 4-hour chart, the bears have been dominating the market tremendously, but the bulls are trying to defend the $7,800 support as well. Meanwhile, the $7,600 and below may come into play if BTC breaks below the mentioned supports.
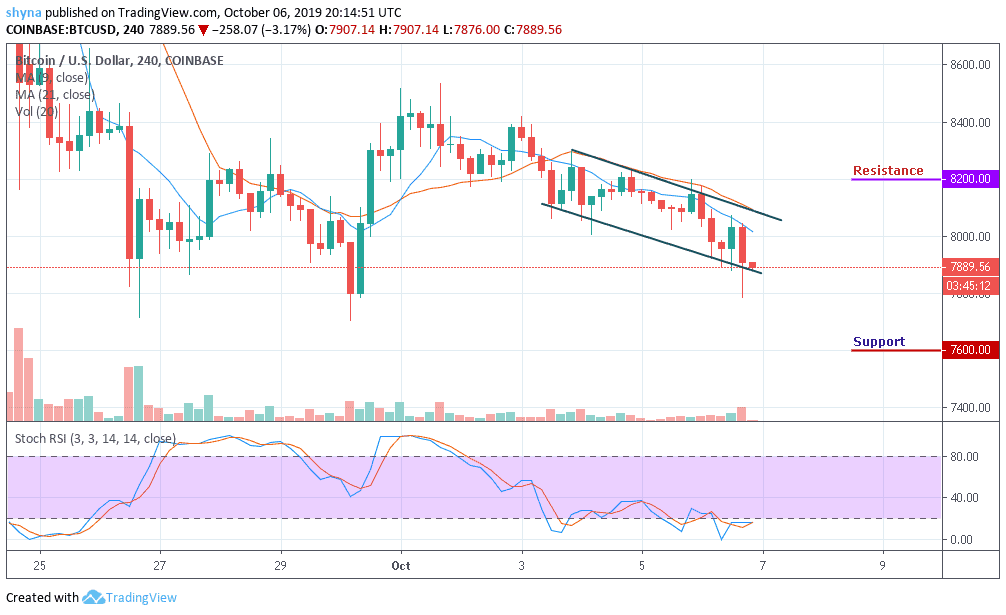
But in as much as the buyers can reinforce and power the market, traders can expect a retest at $8,000 resistance level and breaking this level may further allow the bulls to reach $8,200 and above. The stochastic RSI is at the oversold zone which may turn bullish when faces up.
Please note: Insidebitcoins.com is not a financial advisor. Do your research before investing your funds in any financial asset or presented product or event. We are not responsible for your investing results.
Join Our Telegram channel to stay up to date on breaking news coverage