Join Our Telegram channel to stay up to date on breaking news coverage
The Bitcoin price prediction shows that BTC may slide towards the downside as the cryptocurrency heads to the south.
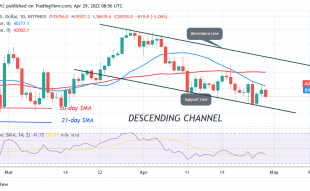
BTC/USD Long-term Trend: Ranging (Daily Chart)
Key levels:
Resistance Levels: $44,000, $46,000, $48,000
Support Levels: $35,000, $33,000, $31,000
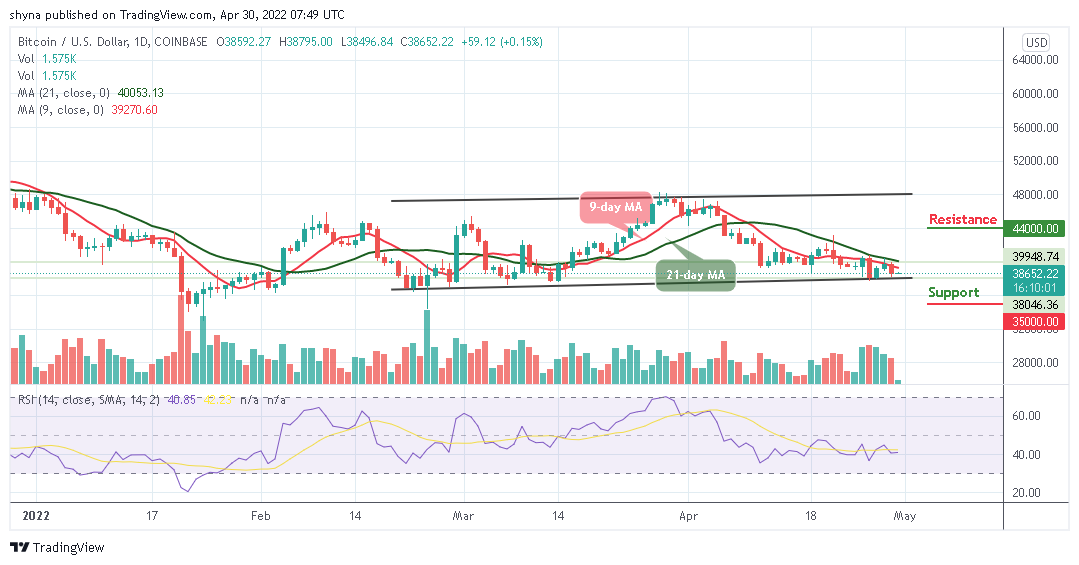
BTC/USD is likely to drop today as the cryptocurrency may fall beneath the $38,500 support level to reach the daily low at $38,000. However, the daily chart reveals that $38,500 is a very important level as it is expected to provide strong support for the coin.
Bitcoin Price Prediction: Bitcoin Price May Cross Below $38,000
The Bitcoin price remains below the 9-day and 21-day moving averages as the coin may cross below the lower boundary of the channel. A breakdown below this barrier may cause the Bitcoin price to create a new low. However, the king coin is currently in a critical position with the next few days dictating the direction that it will head. A drop to the south could be detrimental to Bitcoin as it could lead the coin towards the supports at $35,000, $33,000, and $31,000.
Moreover, if the buyers can rebound from the current level of $38,652, the first level of resistance could lie at $39,000. Above this, further resistance is expected at $40,000. This may likely follow by the potential resistance levels at $44,000, $46,000, and $48,000. Therefore, if the coin can break above these levels, the market may be on the verge of turning bullish in the long term. Presently, the Relative Strength Index (14) is likely to cross below 40-level, indicating that more bearish signals might come to play.
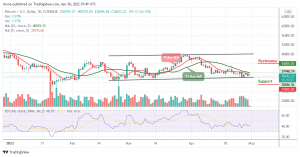
BTC/USD Medium-Term Trend: Bearish (4H Chart)
According to the 4-hour chart, the Bitcoin price is hovering at $38,678 as the coin is likely to cross above the 9-day and 21-day moving averages. However, if the bulls decide to push the market price to the upside, the coin may likely hit the resistance at $40,000 and above.

Nevertheless, it now appears that the cryptocurrency is at risk of seeing further downside as the 9-day MA crosses below the 21-day MA and this seems to indicate that bears are building momentum. As the Relative Strength Index (14) moves above the 40-level, the king coin may locate the critical support at $37,500 and below.
Looking to buy or trade Bitcoin (BTC) now? Invest at eToro!
68% of retail investor accounts lose money when trading CFDs with this provider
Read more:
Join Our Telegram channel to stay up to date on breaking news coverage