Join Our Telegram channel to stay up to date on breaking news coverage
Bitcoin Price Prediction – April 26
The BTC/USD market operation has that the crypto-economic instrument experiences a falling force. Price is trading between $40,824 and $39,376 at a negative percentage rate of about 2.36. Bears are currently dominating the pace at the expense of bulls’ weaknesses in the market.
BTC/USD Market
Key Levels:
Resistance levels: $42,500, $45,000, $47,500
Support levels: $37,500, $35,000, $32,500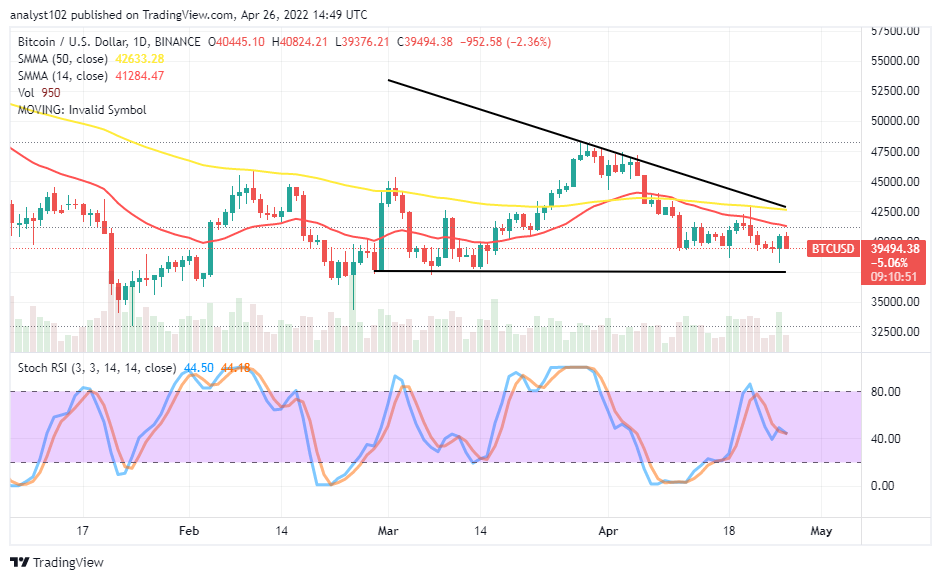 BTC/USD – Daily Chart
The daily chart exhibits the BTC trade worth experiences a falling force, trading against the US Dollar’s market valuation. The 50-day SMA indicator is above the 14-day SMA indicator. The descending triangular shape embodies most of the ups and downs between the $42,500 resistance level and the $37,500 support level over a couple of sessions until the present. The Stochastic Oscillators are southbound, positioning around the range of 40. And they are seemingly trying to clog their lines around it to indicate the probability of getting a pause soon.
Will the BTC/USD market dip more to the $37,500 critical support level as the crypto-economic price experiences a falling force?
From the technical viewing point, it is apparent that the BTC/USD market is yet striving to recover some of its lost momenta as it experiences a falling force after failing to push northward past the trend of the 14-day SMA. A re-occurrence of finding support may feature around the $37,500 critical support line. Long-position takers needed to be on the lookout to spot a bullish candlestick that signifies a return of upward motions before re-launching a buying position.
On the downside of the technical analysis, the BTC/USD market short-position takers needed to increase their efforts to hold positions down to an ideal lower trading zone toward the $37,500. Using lower-time frames can be instrumental in decision-taking exercises in a timely by traders. Investors may have to nurture the approach of buying more while the crypto’s price slides deep into a lower trading zone.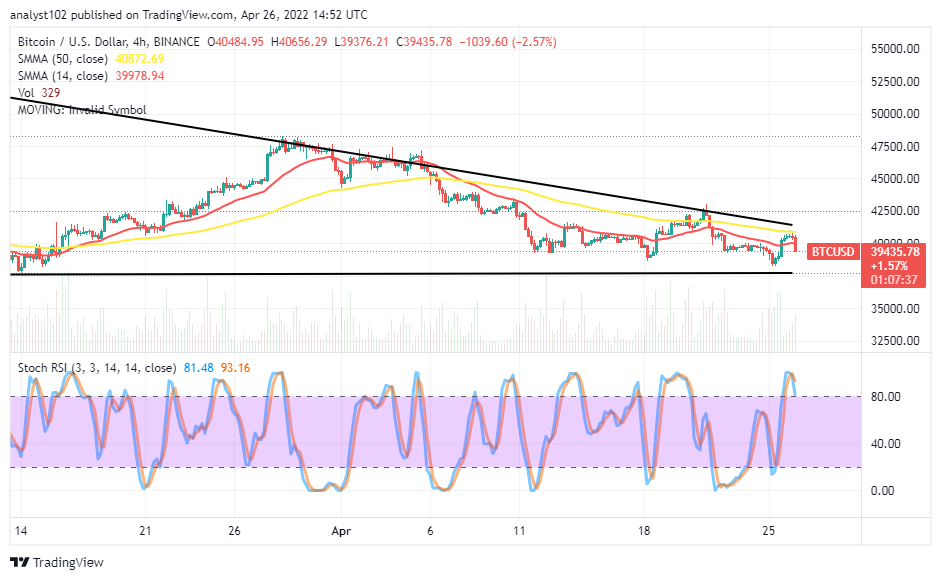
BTC/USD 4-hour Chart
The medium-term chart shows the BTC market price experiences a falling force when it cannot breach the bigger-SMA trend line northward. The 14-day SMA indicator is closely underneath the 50-day SMA indicator within the confinement of the descending triangular pattern drawn to ascertain the area of trading spots of the market. The Stochastic Oscillators are attempting to cross their lines southbound in the overbought region near the range of 80. That signifies that a downward motion is ongoing. An aggressive falling force against the $37,500 will set the market into other lower-trading zones toward the next lower support level at $35,000.
Looking to buy or trade Bitcoin (BTC) now? Invest at eToro!
68% of retail investor accounts lose money when trading CFDs with this provider.
Read more:
Join Our Telegram channel to stay up to date on breaking news coverage