Join Our Telegram channel to stay up to date on breaking news coverage
The Bitcoin price prediction shows BTC sliding towards the downside as the cryptocurrency touches the $40,005 low.
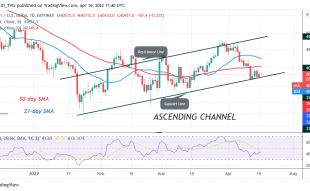
BTC/USD Long-term Trend: Bearish (Daily Chart)
Key levels:
Resistance Levels: $45,000, $47,000, $49,000
Support Levels: $36,000, $34,000, $32,000

BTC/USD drops with another loss of 0.45% today as the cryptocurrency falls beneath the 9-day moving average to reach the daily low at $40,005. However, the daily chart reveals that $40,000 is a very important area as it is expected to provide strong support for the coin.
Bitcoin Price Prediction: Would Bitcoin Price Go Below $40k?
The Bitcoin price begins to slide below the 9-day and 21-day moving averages at support provided by the trend line. A breakdown below the lower boundary of the channel could cause the Bitcoin price to create a new low. However, a drop below the lower boundary of the channel could be detrimental to Bitcoin as it could lead the coin to reach the supports at $36,000, $34,000, and $32,000.
Moreover, if the Bitcoin price crosses above the 9-day moving average, the first level of resistance could lie at $43,000. Above this, further resistance is expected at $44,000. This may likely follow by the potential resistance levels at $45,000, $47,000, and $49,000. At the moment, the Relative Strength Index (14) is likely to cross below 40-level, indicating that more bearish signals might come to play.
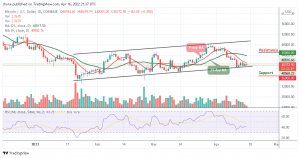
BTC/USD Medium-Term Trend: Bearish (4H Chart)
According to the 4-hour chart, the Bitcoin price is seen hovering at $40,539 as the coin prepares to cross above the upper boundary of the channel. However, if the bulls decide to keep the market price above the 9-day and 21-day moving averages, the coin may likely hit the resistance at $42,000 and above.
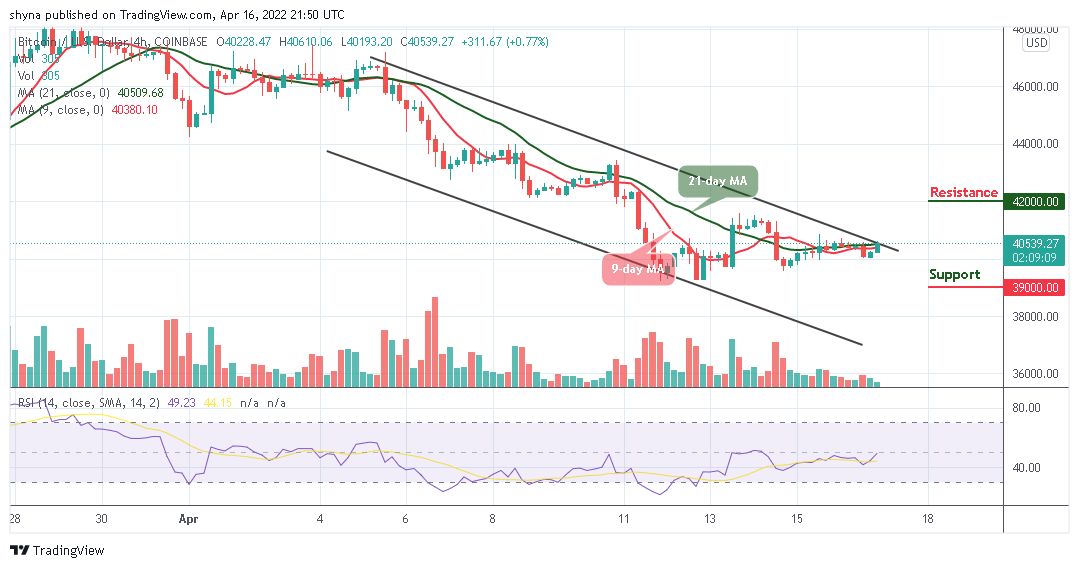
Nevertheless, it now appears that the cryptocurrency is ready for the upward moment as the 9-day moving average moves to cross above the 21-day moving average which may confirm the bullish movement. The Relative Strength Index (14) is likely to cross above 50-level, otherwise, the king coin may locate the support level at $39,000 and below.
Looking to buy or trade Bitcoin (BTC) now? Invest at eToro!
68% of retail investor accounts lose money when trading CFDs with this provider
Read more:
Join Our Telegram channel to stay up to date on breaking news coverage