Join Our Telegram channel to stay up to date on breaking news coverage
Bitcoin (BTC) Price Prediction – January 28
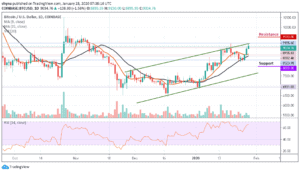
At the time of writing this, Bitcoin (BTC) was trading at $9,034.76, the coin seems to be preparing for another consistent higher high trend.
BTC/USD Long-term Trend: Bullish (Daily Chart)
Key levels:
Resistance Levels: $9,500, $9,700, $9,900
Support Levels: $8,000, $7,800, $7,600
BTC/USD has recently started to mount an extremely strong recovery, bouncing from $8,582 to $9,034. A few minutes ago, as of the time of writing this article, the leading cryptocurrency hit $9,185. Over the last three days, the bulls have taken full control of the BTC/USD market. The price jumped from the $8,323 support level and went to $9,185 resistance level but the coin is seen surging back to the $9,034 resistance price area.
As of now, the market price for BTC/USD is trading above the 9-day and 21-day moving averages. The next resistance levels lies at $9,500, $9,700 and $9,900. Typically when the new uptrends are beginning to form, traders will use the upper boundary of the channel as a pivot resistance point to gauge the strength of the trend. When price levels rise above the trend line, this is a sign of sustainability and will likely result in a continuation of the newly formed trend.
However, should BTC price failed to move up; we may see a price cut to $8,500 vital support. A further low drive could bring the price to $8,000, $7,800 and $7,600 supports. At the moment, the bulls are still defending critical support. But as things stand, the Bitcoin price is rising as the technical indicator RSI (14) is moving towards the 70-level.
BTC/USD Medium-Term Trend: Bullish (4H Chart)
After the crypto faced a long period of upward movement within its previously established trading, Bitcoin bears are now making an attempt to step back into the market pushing the BTC price below its previous price level that existed around $9,103 to $9,012. Although the Bitcoin price has not yet slipped below $9,000, it’s still in the loop of making a bounce back.
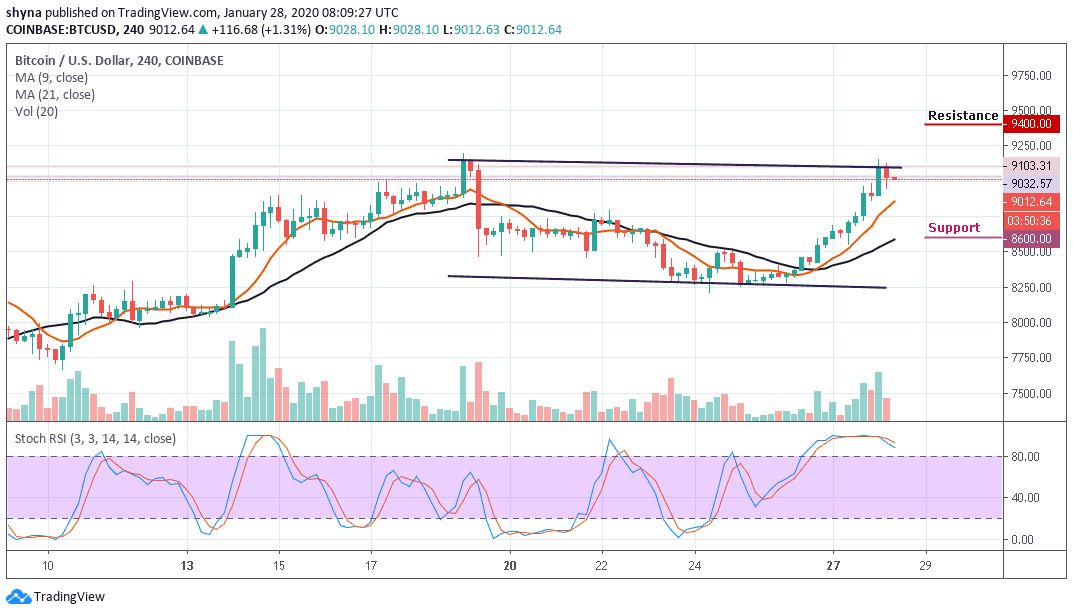
At the moment, BTC/USD is currently moving within the channel but above the 9-day and 21-day moving averages. The upward movement may likely push the price across the upper boundary of the channel and to the nearest resistance at $9,400, $9,600 and $9,800 levels while the immediate and critical support lies at $8,600, $8,400 and $8,200. The stochastic RSI is extremely within the overbought zone.
Please note: Insidebitcoins.com is not a financial advisor. Do your research before investing your funds in any financial asset or presented product or event. We are not responsible for your investing results.
Join Our Telegram channel to stay up to date on breaking news coverage