Join Our Telegram channel to stay up to date on breaking news coverage
Bitcoin (BTC) Price Prediction – March 7
In the past few hours, Bitcoin (BTC) price dropped 2.71%, losing $9,000 and pulling back to $8,910
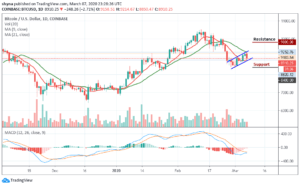
BTC/USD Long-term Trend: Bullish (Daily Chart)
Key levels:
Resistance Levels: $9,800, $10,000, $10,200
Support Levels: $8,400, $8,100, $7,800

After opening at around $9,183, BTC/USD has currently marked low at $8,820 after shorting sharply a few hours ago, allowing the market to see a price drop of about -2.7% at the moment. Touching $9,252 high earlier this month, Bitcoin (BTC) is now roaming at around $8,910 price levels with a medium-term bearish continuation outlook. The abrupt downside move occurred after BTC/USD rallied below the moving averages.
However, should an $8,900 support couldn’t be reclaimed; it’s possible that the price may drop below the 9-day moving average at $8,800. A possible bearish scenario that could play out after the rejection at $9,252 would involve Bitcoin price failing to hold the moving average at $8,500. Losing that zone and we’ll see momentum and $8,400, $8,200 and $8,000 retest downwards as the MACD signal lines are with the negative side.
In the short-term, holding the zone between the 9-day MA and $8,900 support is crucial or a retest of the $8,400 support is likely. But currently, BTC/USD is yet to make a lower low under the $8,500 support so a short phase of consolidation leading to another retest of the $9,800, $10,000 and $10,200 still rating resistance seems more likely than a drop below key support levels.
BTC/USD Medium – Term Trend: Bullish (4H Chart)
After the crypto faced a long period of upward movement within its previously established trading, Bitcoin bears have now stepped back into the market pushing the BTC price below its previous support level that existed around $8,855. Although the Bitcoin price has not yet slipped below $8,500, it’s still in the loop of making a bounce back. Its price hovers around $8,885 and may take time to persistently trade above $8,900.
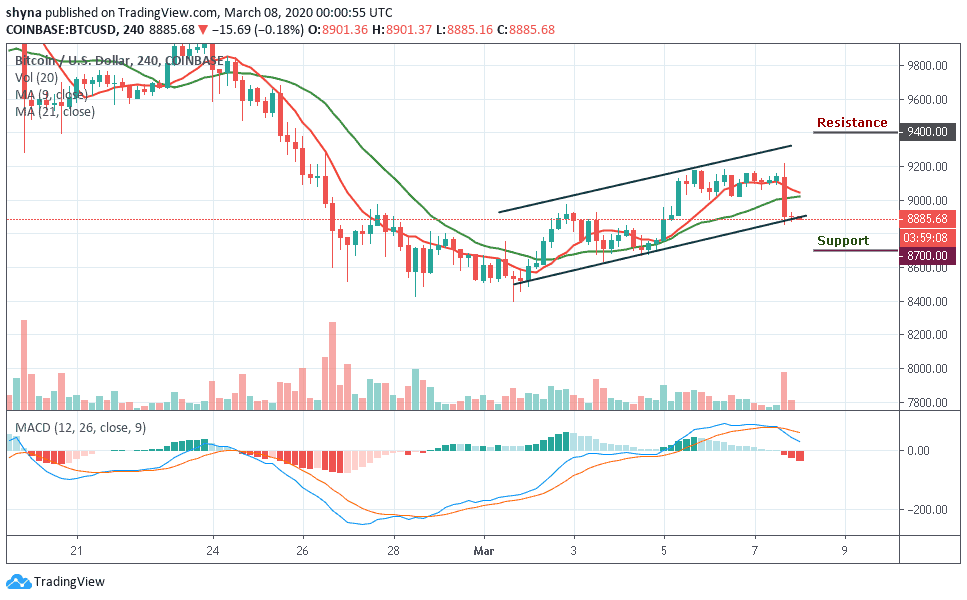
At the moment, BTC/USD is currently moving below the 9-day moving average and 21-day moving averages. The upward movement may likely push the price nearest resistance at $9,400, $9,600 and $9,800 resistance levels while the immediate support lies at $8,700, $8,500 and $8,300. The MACD indicator is still moving within the positive side.
Please note: Insidebitcoins.com is not a financial advisor. Do your research before investing your funds in any financial asset or presented product or event. We are not responsible for your investing results.
Join Our Telegram channel to stay up to date on breaking news coverage