Join Our Telegram channel to stay up to date on breaking news coverage
Bitcoin (BTC) Price Prediction – October 11
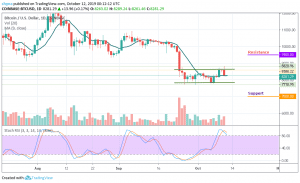
Bitcoin grinds laterally in a narrow range of $7,800 to $8,588. The previous trend is expected to remain around $9,500 due to BTC’s reaction to the flag pattern.
BTC/USD Long-term Trend: Ranging (Daily Chart)
Key levels:
Resistance Levels: $9,500, $10,000 $10,500
Support Levels: $7,000, $6,500, $6,000
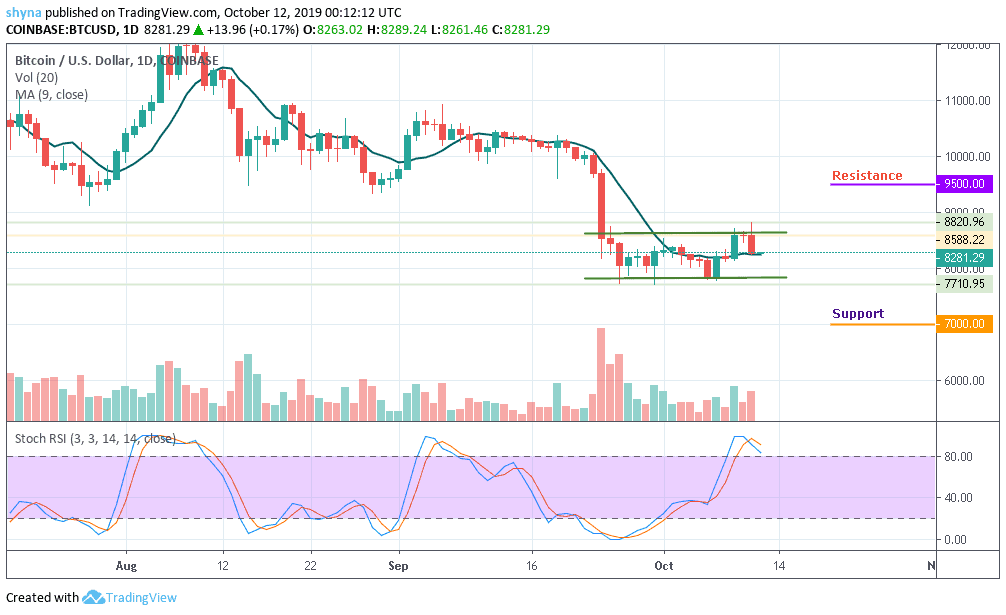
The BTC/USD price has created a false escape today and it’s now trading in the consolidation zone. $8,820 was rejected with some strength and the coin is now trading at $8,281.29. This follows the extension of the leg from vertices slightly above $8,820. The price action from levels close to $8,570 may likely enable a phenomenal recovery above several key resistance levels, including $9,500, $10,000 and $10,500.
Moreover, as the coin is trading at $8,281.29 and displays an intraday loss of 2.59%. The prevailing trend is bearish with expanding volatility. The leader of cryptocurrencies currently consolidates in a bullish flag pattern. A breakout out from this pattern is supposed to continue in the direction of the previous trend. In this case, we expect Bitcoin to rise above $8,750 resistance and move towards the potential resistance levels at $9,500, $10,000 and $10,500.
However, should Bitcoin price failed to remain above the 9-day moving average and move up; the price could drop to $7,500 vital support. A further low drive could send the price to $7,000, $6,500 and $6,000 support. The stochastic RSI has recently revealed a sign of trend reversal, which shows a possible more bearish momentum may likely play out.
BTC/USD Medium-Term Trend: Bullish (4H Chart)
The 4-hour chart shows that the price will soon find its way upward as the stochastic RSI is extremely in the oversold condition. Although, the bears have dominated the market for some time now it is the right time for the bulls to defend the $8,200 support and push the price to the north.
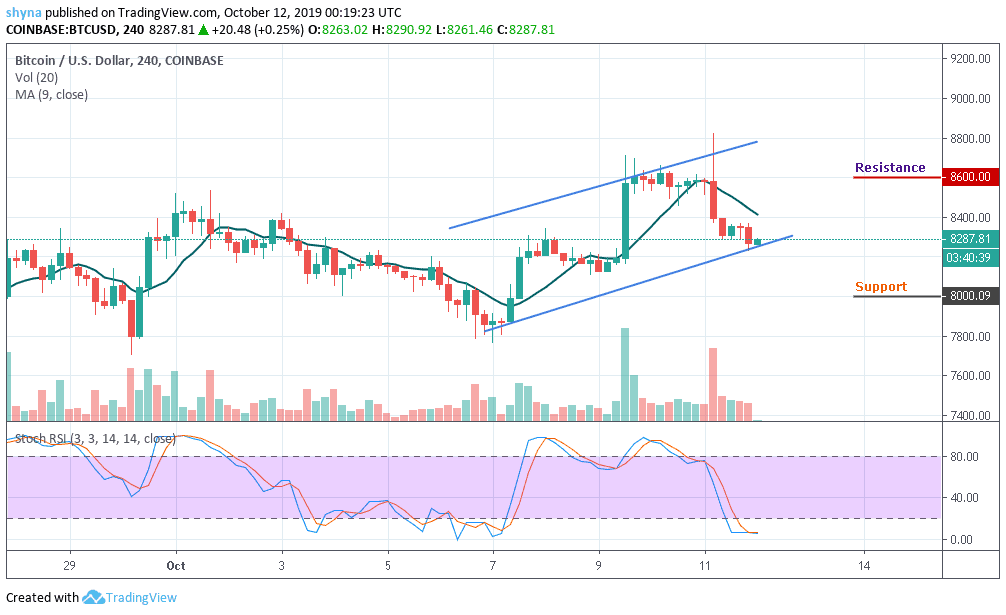
Meanwhile, the support levels of $8,000 and below may come into play if the price breaks below the trend line of the ascending channel. But in as much the buyers have gathered enough momentum to power the market; they can make use of this opportunity to drag the price above the moving average where it could hit the targeted resistance levels of $8,600 and above.
Please note: Insidebitcoins.com is not a financial advisor. Do your research before investing your funds in any financial asset or presented product or event. We are not responsible for your investing results.
Join Our Telegram channel to stay up to date on breaking news coverage