Join Our Telegram channel to stay up to date on breaking news coverage
Bitcoin Price Prediction – October 18
The Bitcoin price slumps below the resistance level of $62,675 as further downside momentum may appear at $60,000 support.
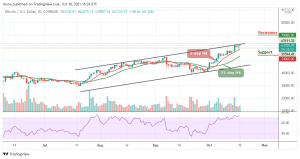
BTC/USD Long-term Trend: Bullish (Daily Chart)
Key levels:
Resistance Levels: $70,000, $72,000, $74,000
Support Levels: $54,000, $52,000, $50,000

BTC/USD soars to $62,675 in the early hours of today as the coin rise to cross above the upper boundary of the channel. Therefore, BTC/USD is hovering at $61,725 after dropping from the daily high. In the meantime, where Bitcoin will go next after this retreat is likely to depend on the ability of the bulls to hold the price above the key support at $62,000.
Bitcoin Price Prediction: Bitcoin Price May Keep the Uptrend
The Bitcoin price remains intact above the 9-day and 21-day moving averages; however, a further retracement seems imminent and it is likely to break above the previous resistance at $62,000. On the contrary, looking at the chart, $54,000, $52,000, and $50,000 serve as the major support levels, making room for BTC to fall even further. The technical indicator Relative Strength Index (14) is still moving within the overbought region, suggesting upward movement.
However, as the daily chart reveals, if the bulls could push the price back above the daily high at $62,675, BTC/USD may see a potential resistance level at $65,000, any further movement could send it to other resistance levels at $70,000, $72,000, and $74,000 respectively.
BTC/USD Medium-Term Trend: Bullish (4H Chart)
Looking at the 4-hour chart, the bulls are coming back into the market as the coin moves above the 9-day and 21-day moving averages. Meanwhile, if BTC/USD breaks above the channel, the $64,000 and above may come into play.
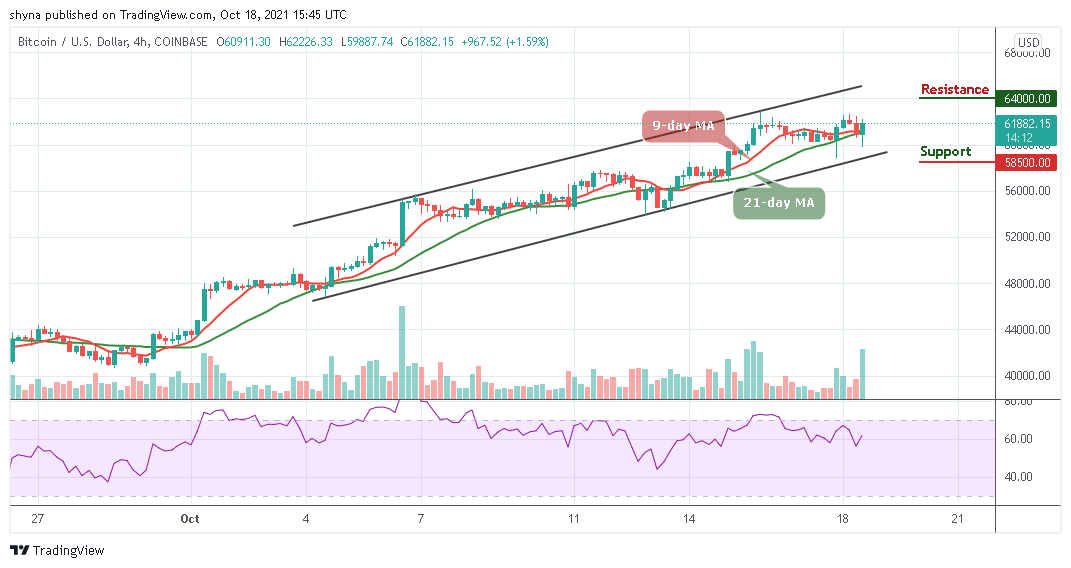
However, if the price breaks below the lower boundary of the channel and falls more, the support levels of $58,500 and below may be in focus. Meanwhile, as the Relative Strength Index (14) moves above 60-level, more bullish signals may play out.
Looking to buy or trade Bitcoin (BTC) now? Invest at eToro!
67% of retail investor accounts lose money when trading CFDs with this provider
Read more:
How to buy Bitcoin
How to buy Cryptocurrency
Join Our Telegram channel to stay up to date on breaking news coverage