Join Our Telegram channel to stay up to date on breaking news coverage
Bitcoin Price Prediction – August 21
The Bitcoin price prediction forms another higher-high as the bulls are aiming for the resistance level of $50,000.
BTC/USD Long-term Trend: Bullish (Daily Chart)
Key levels:
Resistance Levels: $54,000, $56,000, $58,000
Support Levels: $45,000, $43,000, $41,000
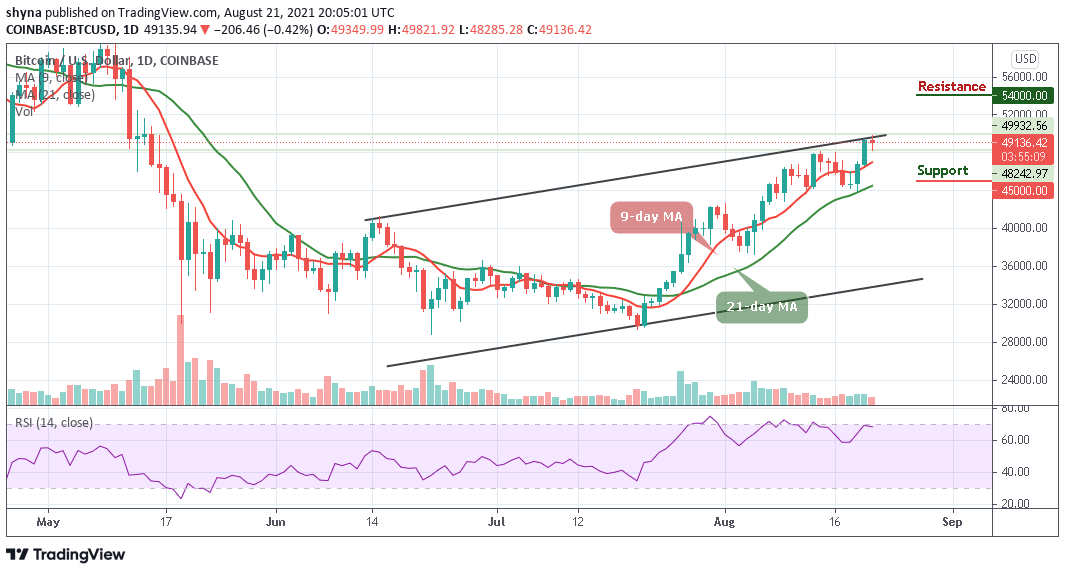
BTC/USD has resumed its upward movement after a brief dip from today’s trading bringing the price from $48,285 to trade at the current level of $49,136. A few days ago, BTC/USD started another upward movement picking the price from the support level of $43,955 after which it headed to a high of around $49,400 yesterday. Today, the price of the leading crypto asset is once again heading towards the north, in fact, it is now returning back below the upper boundary of the channel.
Bitcoin Price Prediction: Bitcoin Price Poised to Explode Above $50,000
The Bitcoin price is now moving above the crucial levels which will now function as the support zones in the event a reversal occurs. Meanwhile, on the upside, as the coin moves and breaks out of the ascending channel, little is in place to prevent correction targeting the key support of $48,500 as the technical indicator Relative Strength Index (14) makes a quick turn below 70-level.
Moreover, if the Bitcoin price move below the 9-day moving average, it could bank on the support levels of $45,000, $43,000, and $41,000 to ensure that in spite of a reversal, the Bitcoin price stays above $49,500 level. Similarly, the nearest resistance levels are located at $54,000, $56,000, and $58,000 as the Relative Strength Index may need to move into the overbought region.
BTC/USD Medium – Term Trend: Bullish (4H Chart)
The 4-hour chart shows that the price may soon be trading sideways as the Relative Strength Index (14) is about moving in the same direction above 60-level. However, the bears may likely bring the current price below the 9-day moving average and it is high time for the bulls to defend the support level of $48,000 and push the price towards the north.
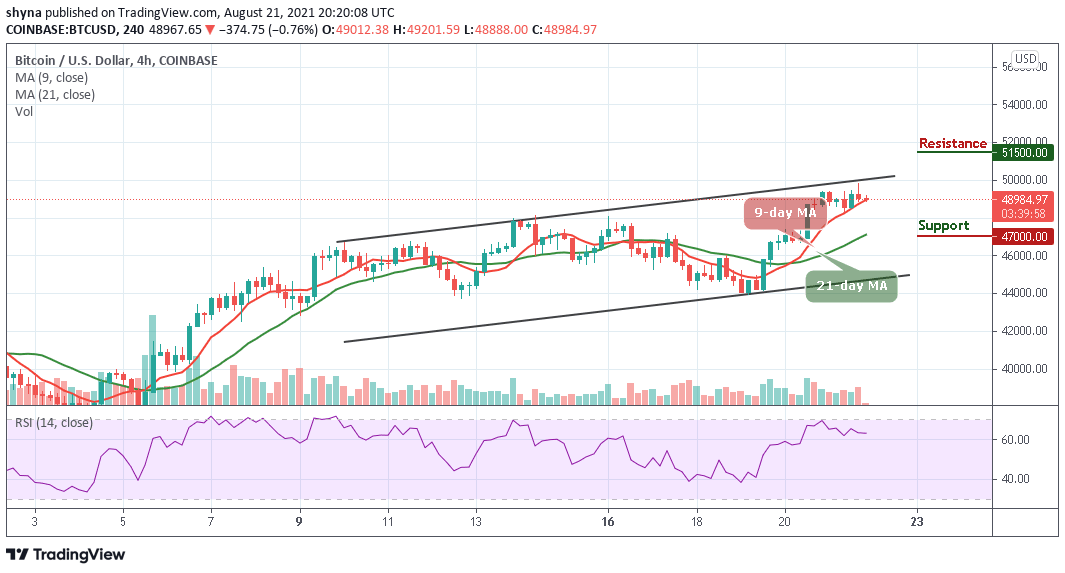
Moreover, the support level of $47,000 and below may come into play if the price breaks below the 21-day moving average. But in as much as the buyers gathered enough momentum to power the market; they can push the price towards the upper boundary of the channel where it could hit the resistance level of $51,500 and above.
Looking to buy or trade Bitcoin (BTC) now? Invest at eToro!
75% of retail investor accounts lose money when trading CFDs with this provider
Join Our Telegram channel to stay up to date on breaking news coverage