Join Our Telegram channel to stay up to date on breaking news coverage
Bitcoin (BTC) Price Prediction – March 21
The Bitcoin price is trading nicely above the $6,100 but it must climb above the $6,500 resistance to continue higher.
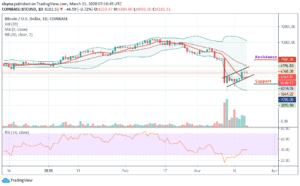
BTC/USD Long-term Trend: Bullish (Daily Chart)
Key levels:
Resistance Levels: $7,800, $8,000, $8,200
Support Levels: $4,700, $4,500, $4,300

As the daily chart reveals, BTC/USD bulls may slowly come back into action after a minor battering from the bears. If this happens, then the expectation of recovery could turn out to be true. Today, BTC/USD is seen trading at $6,161 after soaring to $6,996 yesterday. The coin then pulled back to where it is trading currently and may continue to head downwards if the bears step back into the market.
However, the market is deciding above the 9-day moving average, where the buyers and sellers are anticipating a clear breakout or breakdown. Meanwhile, the $6,500 and $6,700 level may further surface as the key resistances should the $6,300 level holds. However, a strong bullish spike may take the price to $7,800, $8,000 and $8,200 levels.
Moreover, if the market makes a quick turn to the south, the BTC/USD price may drop to $6,000 and should this support fails to contain the sell-off; traders may see a further roll back to $4,700, $4,500 and critically $4,300. The technical indicator RSI (14) moves in sideways, which suggests an indecisive in the market at the moment.
BTC/USD Medium – Term Trend: Bullish (4H Chart)
Looking at the 4-hour chart, since yesterday, the bears are making an attempt to step back into the market by bringing the price from $6,978 to $5,675, but the bulls quickly held the support by picking the price from there to where it is currently trading at $6,153 which is below the 9-day moving average. Meanwhile, the $7,000 and above may come into play if BTC/USD breaks above the channel.
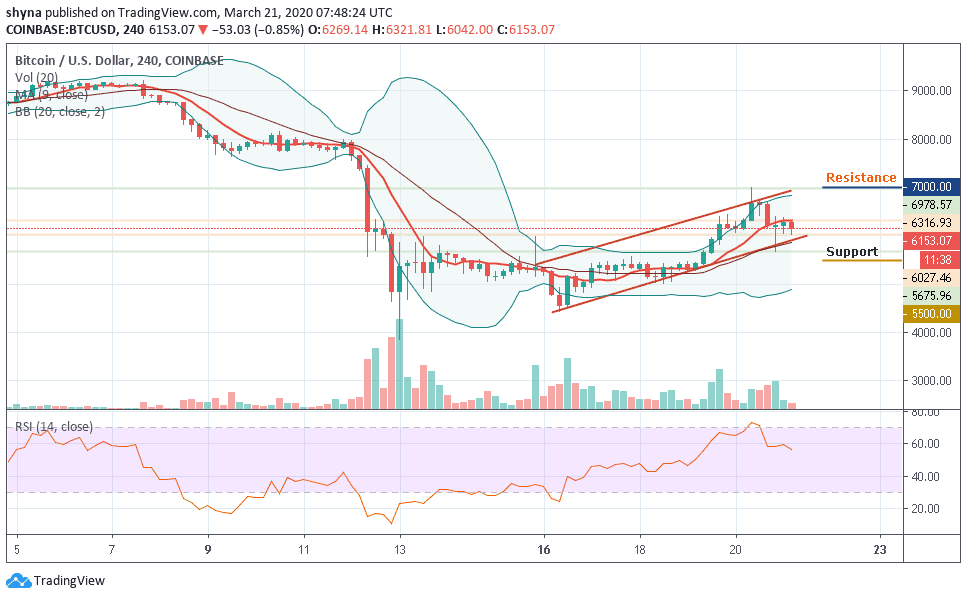
However, if the price continues to move below the 9-day moving average of the ascending channel and begins to fall, the support levels of $5,500 and below may be visited. Meanwhile, as the RSI (14) nosedives below 60-level, more bearish signals may play out before a rebound could come in.
Please note: Insidebitcoins.com is not a financial advisor. Do your research before investing your funds in any financial asset or presented product or event. We are not responsible for your investing results.
Join Our Telegram channel to stay up to date on breaking news coverage