Join Our Telegram channel to stay up to date on breaking news coverage
Bitcoin (BTC) Price Prediction – February 24
The Bitcoin (BTC) price has remained gloomy since the massive decline of February 19.
BTC/USD Long-term Trend: Bullish (Daily Chart)
Key levels:
Resistance Levels: $10,600, $10,800, $11,000
Support Levels: $9,100, $8,900, $8,700
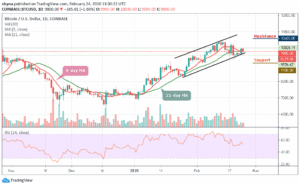
BTC/USD has been struggling to maintain its position above $10,000 before its price saw another dive below the $10,028 mark today. The coin is in a dangerous position as the price slipped below the 9-day and 21-day moving averages during early Asian hours. If the breakthrough is confirmed, the downside momentum will gain traction with the next focus on $9,500. At the time of writing, Bitcoin was trading at $9,800 with a decline of 1.66% on the daily price chart.
Moreover, if we look at the price movement since the beginning of the year, we can see that the coin has registered some amount of growth. BTC/USD started the year trading at $7,206 and moved above $10,500 before starting the downward journey. In the last 54 days, the highest recorded price of BTC was $10,517 and the coin is capable of moving past this value in as much as 9-day MA is above the 21-day MA.
However, should BTC price failed to move up; we may see a price cut to $9,400 vital support. A further low drive could send the price to $9,100, $8,900 and $8,700 support levels while the resistance levels to watch are $10,600, $10,800 and $11,000. The RSI (14) indicator suggested a probable bearish crossover in the near future. This bearish crossover falls in line with the crossing below the moving averages.
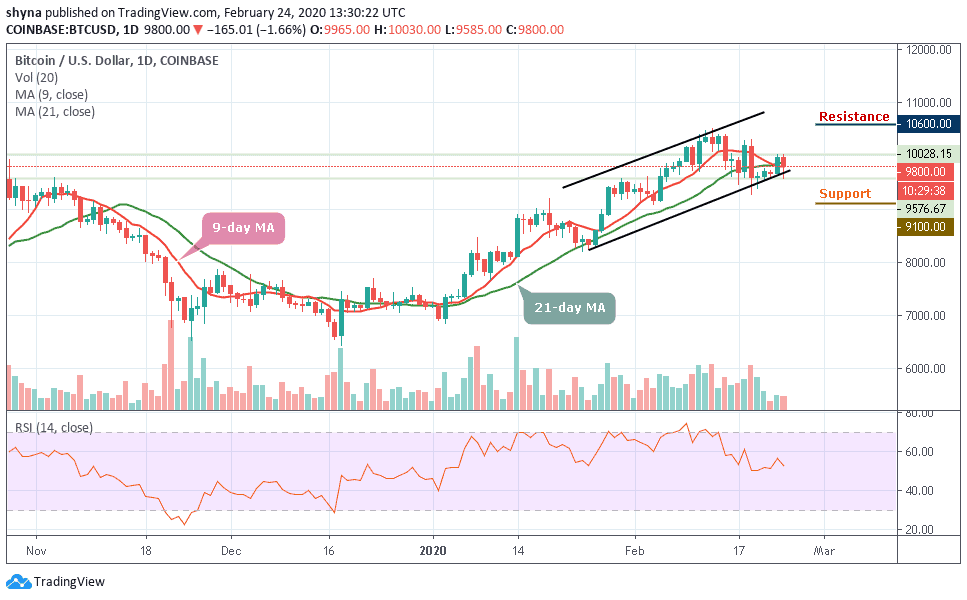
BTC/USD Medium – Term Trend: Bearish (4H Chart)
The 4-hour chart shows that the price may soon find its way upward as the RSI (14) is about to cross above the 9-day moving average. Although the bears have been making effort to drag the price below the 21-day moving average for some time now, it is the right time for the bulls to defend the $9,600 support and push the coin to the north.
Meanwhile, the support levels of $9,500 and below may come into play if the price breaks below the previous low of the ascending channel. But in as much the buyers have gathered enough momentum to power the market; they can make use of this opportunity and push the price above the moving averages where it could hit the targeted resistance levels of $10,100 and above.
Please note: Insidebitcoins.com is not a financial advisor. Do your research before investing your funds in any financial asset or presented product or event. We are not responsible for your investing results.
Join Our Telegram channel to stay up to date on breaking news coverage