Join Our Telegram channel to stay up to date on breaking news coverage
Bitcoin (BTC) Price Prediction – February 14
The Bitcoin bulls kept on pushing towards the north as the coin has not lost sight of $11,000 despite the rejection of $10,500.
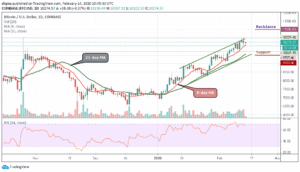
BTC/USD Long-term Trend: Bullish (Daily Chart)
Key levels:
Resistance Levels: $11,000, $11,200, $11,400
Support Levels: $9,500, $9,300, $9,100

BTC/USD has been losing ground since yesterday in the middle of the technical correction as bulls stumbled upon a stiff resistance created by $10,500. At the time of writing, BTC/USD is changing hands at $10,274, up 0.37% on a day-to-day basis. With the total market capitalization of $186 billion, BTC controls over 65.9% of the market. Despite the retreat, the coin has finished three consecutive days above $10,000.
However, looking at the daily chart, BTC/USD stays above the 9-day and 21-day moving averages. This helped to stop the sell-off that occurred yesterday, and it still has the potential to limit the correction today. If this support is broken, the sell-off may be extended towards psychological $10,000, reinforced by 9-day MA. A cluster of stop-orders located around this area is likely to create a protective buffer for BTC ahead of the weekend.
Meanwhile, the critical support comes at $9,500, $9,000 and $8,500 levels, which is around the lower boundary of the channel reinforced by 21-day MA. On the upside, a sustainable move above the resistance of $10,300 level may improve the short-term technical picture and bring $10,500 back into focus. More so, with recent high, the potential resistance levels lie at $11,000, $11,500 and $12,000.
In other words, the downward-looking RSI (14) on the daily chart implies that BTC may extend the correction; however, in the long-run, the bullish trend is still intact.
BTC/USD Medium – Term Trend: Bullish (4H Chart)
Looking at the hourly chart, following the rejection of $10,500, BTC/USD is trading below the $10,300 resistance level. From above, should in case the Bitcoin hold above $10,300, then the next level of resistance is $10,400 before the 2020 high at $10,500, along with the significant mentioned ascending trend-line. The next resistance would be $10,600, followed by $10,800 and $11,000.
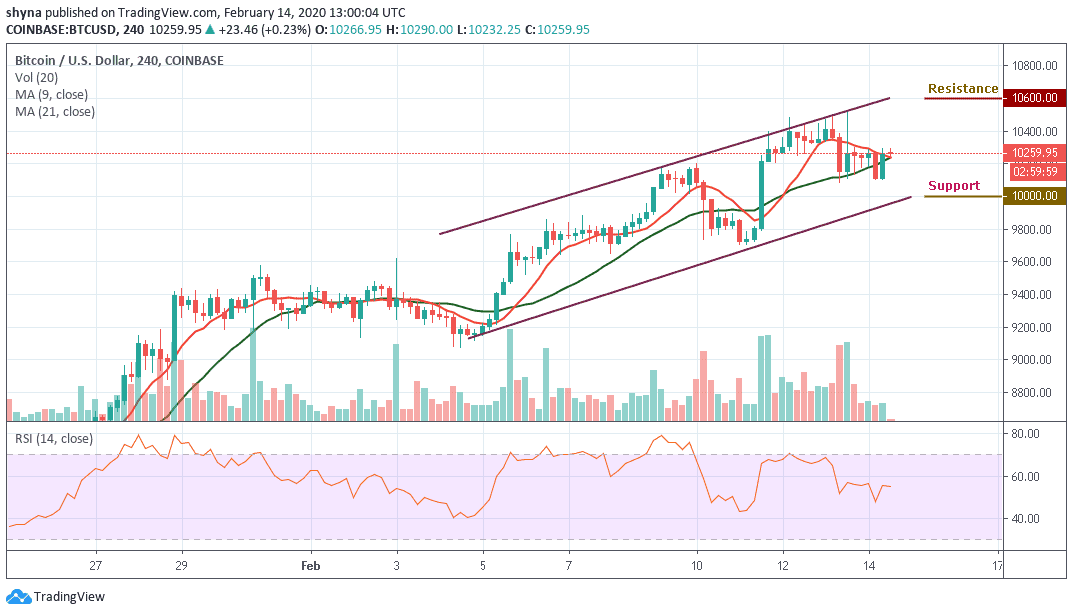
Furthermore, as the technical indicator moves below 60-level, this might have signaled a temporary end to the bullish trend of Bitcoin. However, as at the time of writing, the RSI (14) indicator is encountering the crucial higher lows trend-line. If it fails to find support here, then we can expect the correction to get even deeper, which may likely reach the support levels of $10,000, $9,800 and $9,600 respectively.
Please note: Insidebitcoins.com is not a financial advisor. Do your research before investing your funds in any financial asset or presented product or event. We are not responsible for your investing results.
Join Our Telegram channel to stay up to date on breaking news coverage