Join Our Telegram channel to stay up to date on breaking news coverage
Bitcoin Price Prediction – July 21
The Bitcoin price finally breached its previous all-time high of $31,000, as it moved above the $32,000 level.
BTC/USD Long-term Trend: Bearish (Daily Chart)
Key levels:
Resistance Levels: $36,000, $38,000, $40,000
Support Levels: $26,000, $24,000, $22,000
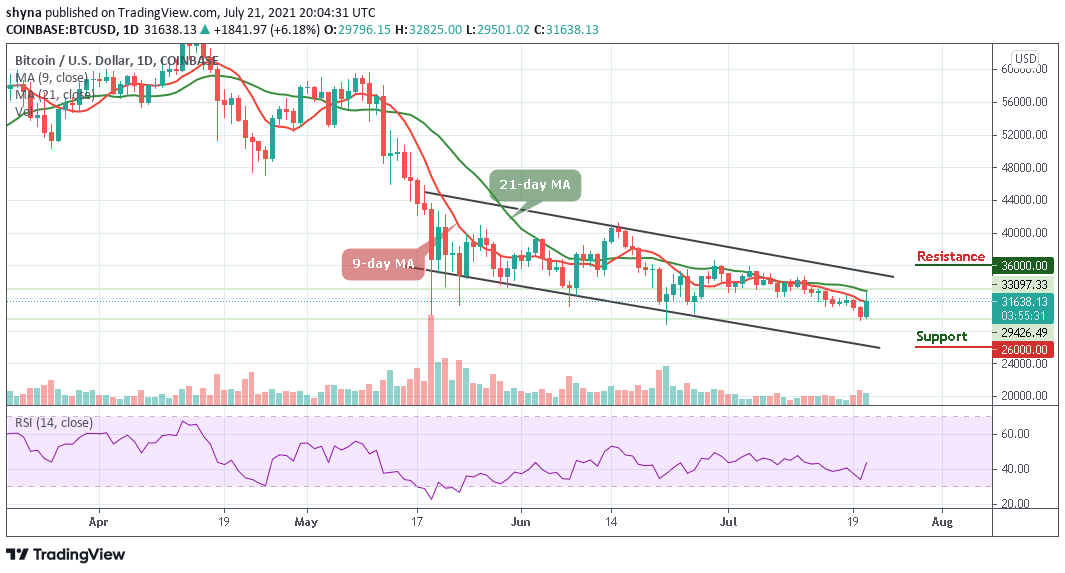
BTC/USD is following the bullish movement, and it seems bent on breaking new grounds.
After a tumultuous day of trading, the coin has just painted a new high for this week, as it now trades at $31,638.
As the market remains within the 9-day and 21-day moving averages, the Bitcoin price spikes just in time.
Bitcoin Price Prediction: Is BTC Price Ready for the Upside?
The daily chart reveals that the Bitcoin price is planning to move above the 9-day and 21-day moving averages in other to cross the upper boundary of the channel as the price establishes a new bullish signal.
With the look of things, the market’s long-term outlook now favors the bulls, giving the daily close produced a large bullish engulfing candle with eyes now set on the daily resistances at $36,000, $38,000, and $40,000, respectively.
However, any rejection at the current level could eventually lead to declines to the critical support below the 9-day and 21-day moving averages.
If BTC drops and touches the low of $30,000 support, then the coin can rely on the long-term support levels at $26,000, $24,000, and $22,000.
Moreover, the technical indicator Relative Strength Index (14) has now crossed above 40-level, suggesting more bullish signals.
BTC/USD Medium-term Trend: Bearish (4H Chart)
According to the 4-hour chart, the Bitcoin price is touching the daily high at $32,825.
However, today’s price move happens to be the most impressive as it climbs above the long-awaited resistance level of $32,000 with a sharp upsurge.
More so, Bitcoin’s price is now maintaining its bull-run above $31,500 as the Relative Strength Index (14) moves above 55-level.
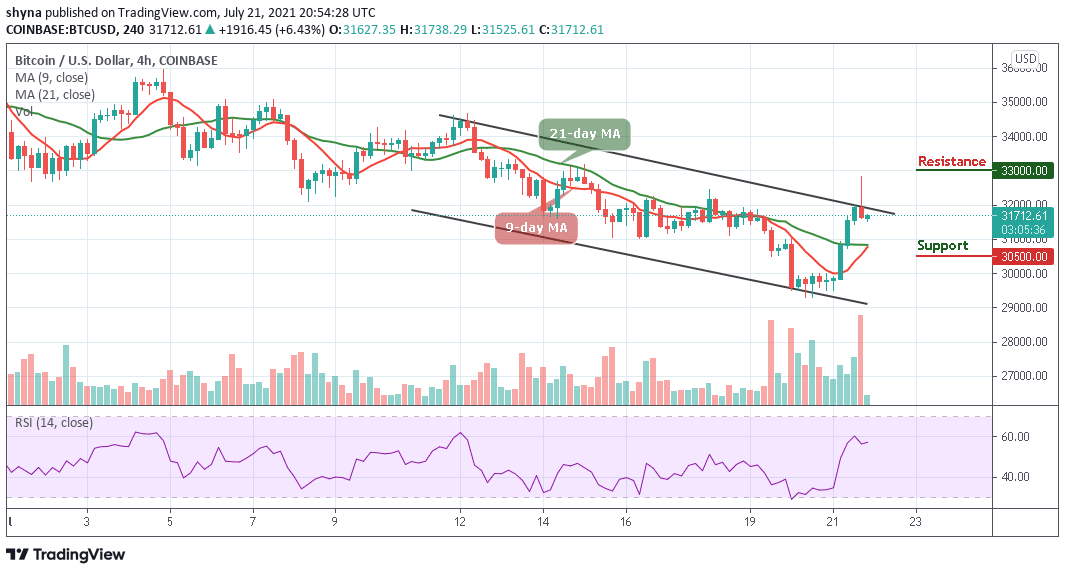
On the other hand, BTC/USD may decide to take a downward move if the bulls fail to push the price higher again.
Therefore, the coin may breach below the 9-day and 21-day moving averages and could reach another support at $30,500 and below.
Nevertheless, if the bulls find a decent resistance level of around $32,500, the coin may continue bullish movement above the channel at the resistance level of $33,000 and above.
Looking to buy or trade Bitcoin (BTC) now? Invest at eToro!
75% of retail investor accounts lose money when trading CFDs with this provider
Join Our Telegram channel to stay up to date on breaking news coverage