Join Our Telegram channel to stay up to date on breaking news coverage
Bitcoin Price Prediction – June 26
The Bitcoin price is down to touch a low of $30,173 as there is no quick recovery that seems possible for the coin at the moment.
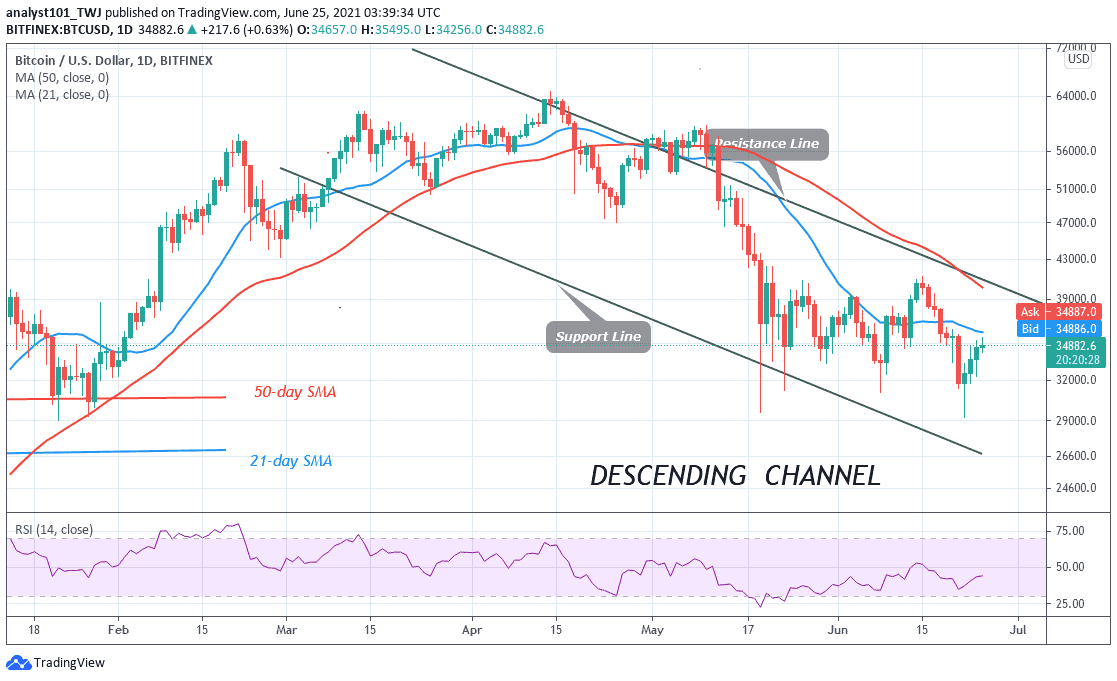
BTC/USD Long-term Trend: Ranging (Daily Chart)
Key levels:
Resistance Levels: $38,000, $40,000, $42,000
Support Levels: $27,000, $25,000, $23,000
BTC/USD is diving below $32,000 as the price is currently consolidating around $31,709, with a few bearish signals. However, the recent correction to the upward failed near the $32,800 level. It seems like Bitcoin bulls are struggling to gain momentum above the $32,000 level.
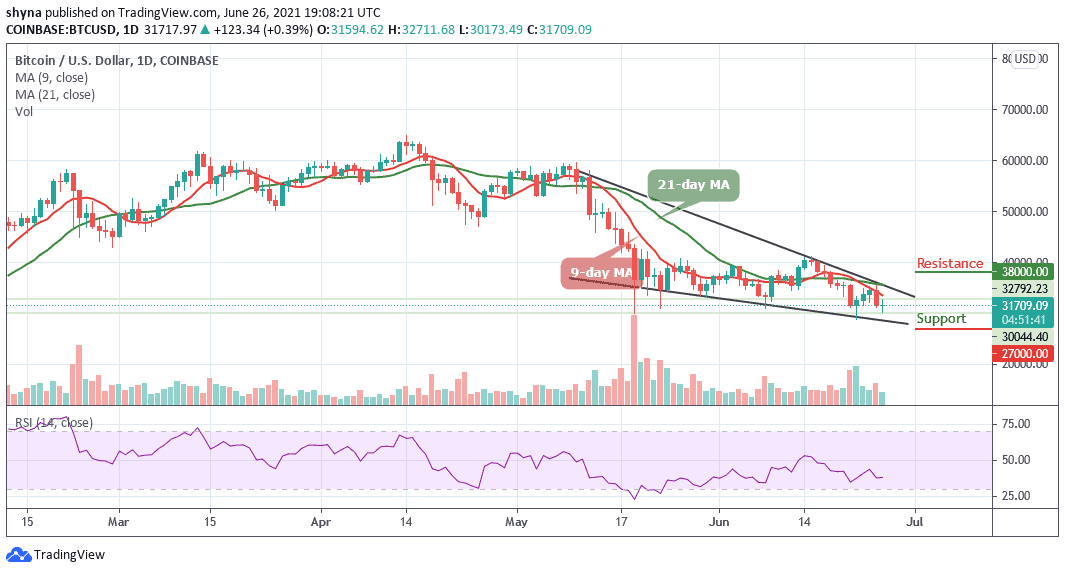
Bitcoin Price Prediction: Would Bitcoin Go Up?
At the time of writing, the Bitcoin price is trading below the 9-day and 21-day moving averages. On the downside, the $31,000 and $30,000 are initial supports. Therefore, if the bulls fail to defend the recent low of $30,173, there is a risk of a sharp decline. However, if the bears drag the price below the lower boundary of the channel, then, the Bitcoin price could drop to the critical supports of $27,000, $25,000, and $23,000 respectively.
Nevertheless, if there is a clear break above the 9-day moving average, the Bitcoin price could touch the $33,500 resistance level. If the bulls manage to gain strength above $34,000, there are chances of a decent recovery towards the $36,000 resistance area. More so, the key breakout zone is near the $38,000, $40,000, and $42,000 resistance levels. Meanwhile, the Relative Strength Index (14) for BTC/USD is moving below the 40-level, suggesting more bearish signals.
BTC/USD Medium – Term Trend: Ranging (4H Chart)
During the European session, the Bitcoin price a daily high at $32,711 but has dropped and still trading below the 9-day and 21-day moving averages, bringing its price to reach the low of $30,173. More so, if the price continues to drop further and moves below the channel, it could reach the support levels of $29,000, $27,000, and $25,000.
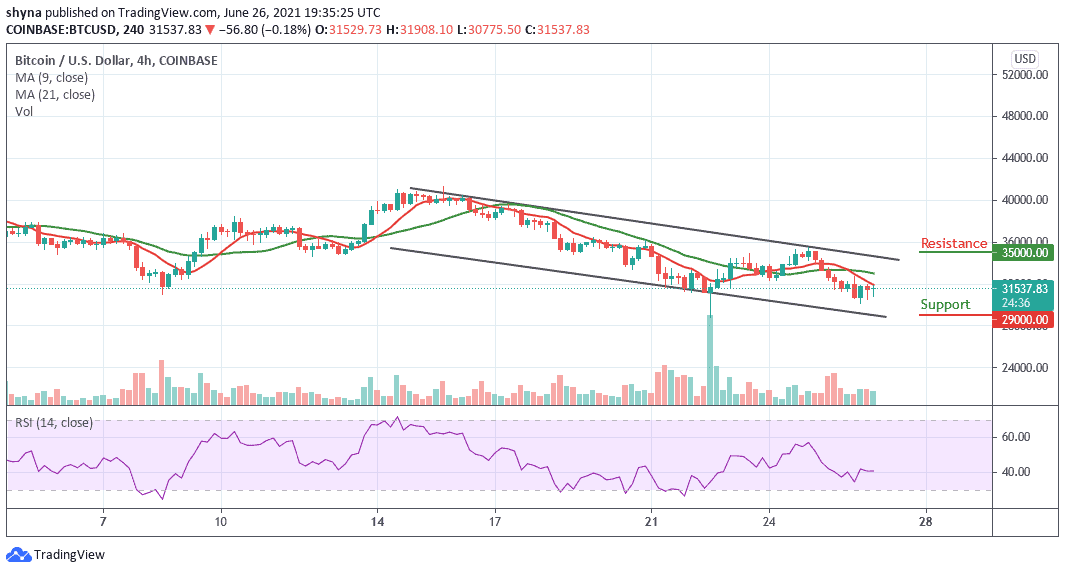
On other hand, if the bulls push the coin above the 9-day and 21-day moving averages, the Bitcoin price may likely hit the potential resistance levels of $35,000, $33,000, and $31,000. At the moment, the hourly market is ranging as the Relative Strength Index (14) moves sideways around 40-level.
Looking to buy or trade Bitcoin (BTC) now? Invest at eToro!
75% of retail investor accounts lose money when trading CFDs with this provider
Join Our Telegram channel to stay up to date on breaking news coverage