Join Our Telegram channel to stay up to date on breaking news coverage
Bitcoin Price Prediction – September 16
The Bitcoin price prediction shows BTC dropping from $48,499 to $47,228 in less than a few hours but managed to recover a little bit.
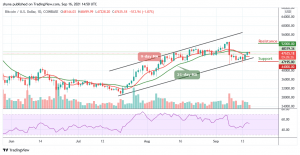
BTC/USD Long-term Trend: Ranging (Daily Chart)
Key levels:
Resistance Levels: $52,000, $54,000, $56,000
Support Levels: $44,000, $42,000, $40,000
BTC/USD is trading down marginally at its current price of $47,635 as the coin is falling below the 9-day moving average and undergoing rejections at $48,499 which is not positive for the bull case. Although the bulls have tried and failed on multiple separate occasions to gather enough buying pressure to break the $48,500 resistance level, each attempt has failed simultaneously.
Bitcoin Price Prediction: Bitcoin (BTC) May Drop Further
The Bitcoin price is currently trading below the 9-day moving average after an attempt by the bears to take the price down to $47,000. The move happened in less than one hour after Bitcoin touched the daily high of $49,499 which is an important resistance level on the daily chart but the bears manage to retreat from the daily high to $47,635 where it is currently trading.
However, it is important to note that Bitcoin’s inability to post any sustained closes above the $48,000 level shows that it is currently plagued by underlying weakness. This consolidation phase has given rise to a plethora of bearish divergences that may cause the cryptocurrency to see a notable retrace in the days ahead.
Moreover, the potential resistance levels for the coin are located at $52,000, $54,000, and $56,000 while the critical supports lie at $44,000, $42,000, and $40,000 as the Relative Strength Index (14) moves to the south, suggesting more bearish signals.
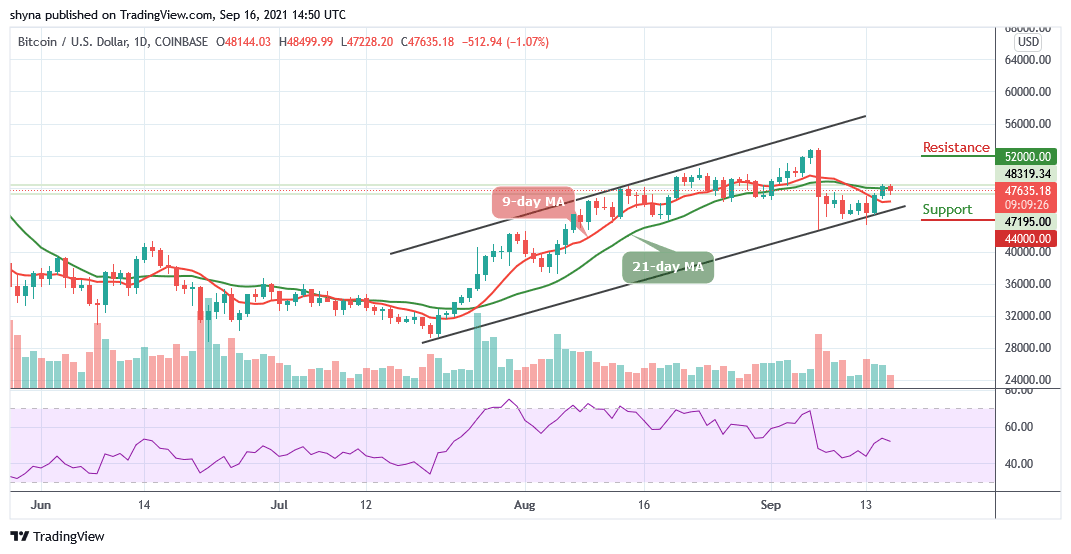
BTC/USD Medium-Term Trend: Ranging (4H Chart)
On the 4-Hour chart, the immediate support is below the 9-day moving average at the $47,000 level. The price may likely fall below this level if the bears fully stepped back into the market, a further movement could test the critical support at the $46,000 level and below while the resistance is located above the upper boundary of the channel at $50,000 and above.
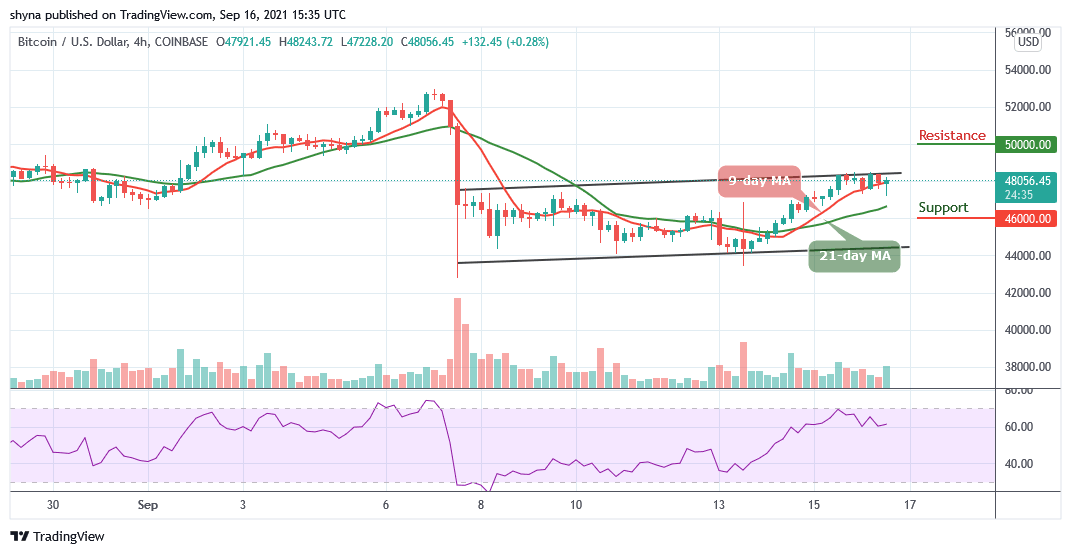
Looking at it technically, the Bitcoin price is currently moving sideways as the technical indicator Relative Strength Index (14) moves above 60-level.
Looking to buy or trade Bitcoin (BTC) now? Invest at eToro!
67% of retail investor accounts lose money when trading CFDs with this provider
Read more:
Join Our Telegram channel to stay up to date on breaking news coverage