Join Our Telegram channel to stay up to date on breaking news coverage
Bitcoin (BTC) Price Prediction – November 13
Bitcoin price is struggling to gain ground above $8,800 and recently, BTC traded as low as $8,576.
BTC/USD Long-term Trend: Bearish (Daily Chart)
Key levels:
Resistance Levels: $9,300, $9,600, $9,900
Support Levels: $8,200, $7, 900, $7,600

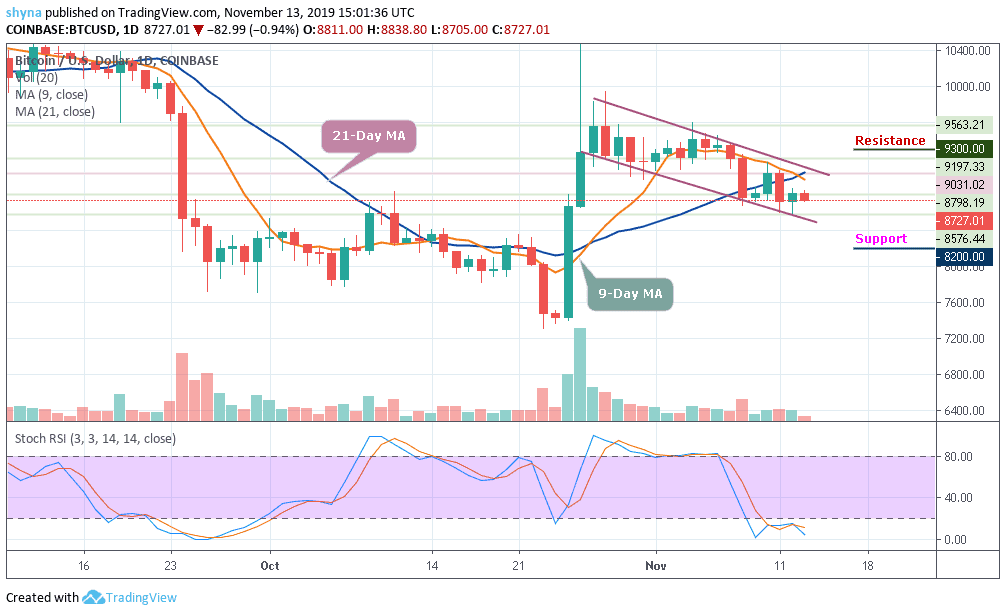
Bitcoin (BTC) faces the incapability to compete and hold on to its current trading levels as the coin moves in the selling zone, with no grounded support by the moving averages. BTC/USD has been recording consecutive losses and trades in red consistently. The coin has been digging in deeper to plunge as it becomes consistent with its loss-making nature recently. The recent decline was such that the price traded below the $8,600 level.
Similarly, Bitcoin might have faced a setback, for now, this is not a permanent one but the coin is likely to have a bullish run in the short-term and a price rally may help the Bitcoin price to touch its monthly high. Currently, Bitcoin is trading below the 9-day and 21-day moving averages around $8,734 level after a free fall from $9,031 a few days back. The coin has shown tremendous volatility over the past 2 weeks.
Meanwhile, looking at the daily chart, $8,200, $7,900 and $7,600 serves as the major support levels which may likely give room for BTC to fall even further. The stochastic RSI for the coin is extremely at the oversold as the trading volume is fading out. BTC/USD may decide to visit the resistance levels at $9,300, $9,600 and $9,900.
BTC/USD Medium-Term Trend: Ranging (4H Chart)
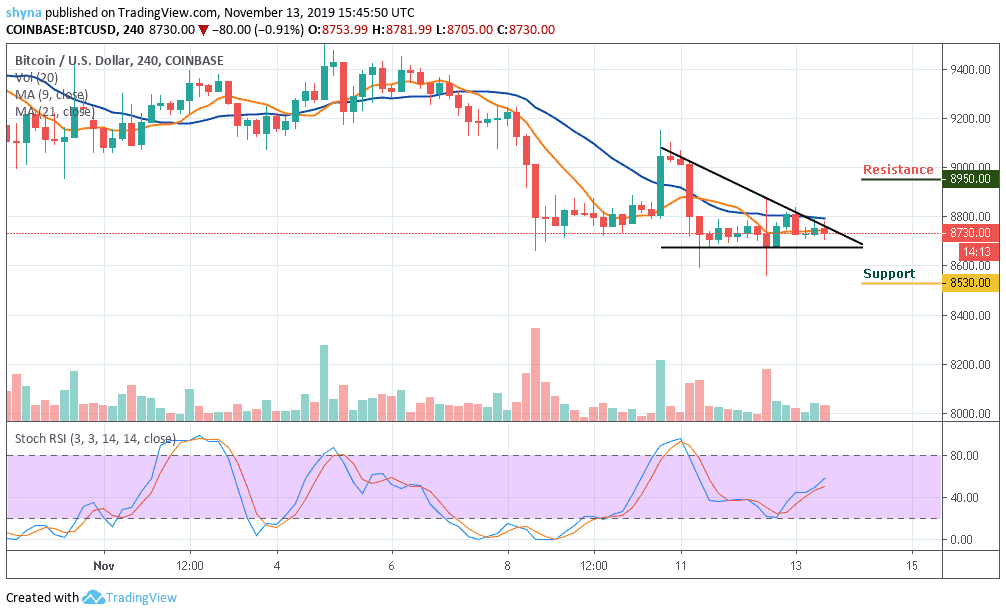
Looking at the 4-hour chart, BTC/USD had a strongly bearish moment and the price is adjusted and now trading at $8,730. The hourly breakdown shows that the price moves in sideways and may soon break out to face the resistance level of $8,800 and above. More importantly, the stochastic RSI faces upward, which gives an indication that the price may likely move to the north.

More so, if buyers can strengthen and energize the market, we can expect a retest of $8,880 resistance level. Therefore, breaking the mentioned resistance could also allow the bulls to test the $8,950, $9,250 and $9,500 upward. In other words, if the bears hold the price and push it downward, then the support level of $8,530 and below will be visited.
Please note: Insidebitcoins.com is not a financial advisor. Do your research before investing your funds in any financial asset or presented product or event. We are not responsible for your investing results.
Join Our Telegram channel to stay up to date on breaking news coverage


