Join Our Telegram channel to stay up to date on breaking news coverage
Bitcoin (BTC) Price Prediction – October 16
The Bitcoin price books loss with its daily movement. The price breaks the freeze zone at $8,175.
BTC/USD Long-term Trend: Bearish (Daily Chart)
Key levels:
Resistance Levels: $9,200, $9,500 $9,800
Support Levels: $7,000, $6,700, $6,400
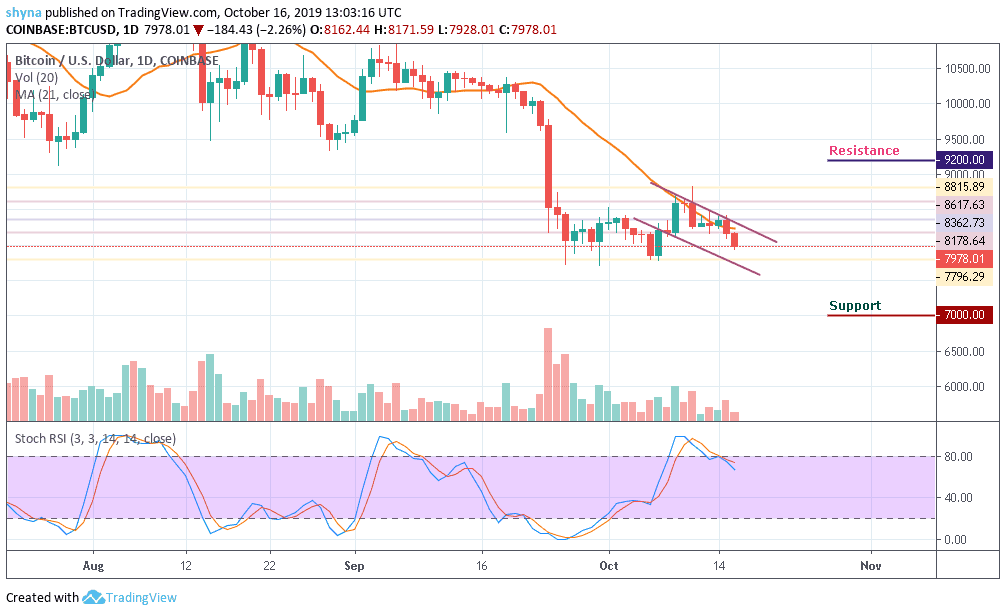
BTC/USD was seen trading around $8,300 for a long time now. Last week, the price slipped to $7,900, but soon recovered and kept itself tight around the above-mentioned level. The current market scenario is indicating a bearish trend moving below the 21-day MA. The past days had been boring for the crypto traders, whereas the Bitcoin price is ‘stuck’ between a tight range of $8,000 and $8,600.
However, Bitcoin just plunged below $8,000 one more time, marking $7,978 as the current daily low at the moment. What does it mean? Is Bitcoin finally leaving the significant $8,000 support level and searching for new lows? In other words, by looking at the declining daily volume candles, together with the steady but stable recent Bitcoin price action, we can assume that a stronger move may be coming up soon.
As of writing this, Bitcoin is struggling to maintain the $8,000 support level. If the coin fails to do so, then the next support levels are likely to be $7,000, $6,700 and $6,400. From above, maintaining the $8,000 level could send Bitcoin to retest old support turned resistance levels at $8,200. The further movement could go above the significant 21-day moving average, which could send the price to $9,200, $9,500 and $9,700 resistance levels.
The stochastic RSI has recently revealed a sign of trend reversal, which shows a possible more bearish momentum may likely play out.
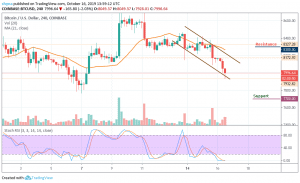
BTC/USD Medium-Term Trend: Bearish (4H Chart)
According to the 4-hour chart, the bears have dominated the market and the price has dropped far from the 21-day moving average heading towards the south. However, if the price breaks below the trend line of the descending channel and continues to fall, the support levels of $7,700 and below may come into play.

Meanwhile, as the stochastic RSI is extremely at the oversold zone, on its way back to the top, the buyers would have gathered enough momentum to fuel the market and they may push the price above the moving average where it could hit the targeted resistance levels of $8,300 and above.
Please note: Insidebitcoins.com is not a financial advisor. Do your research before investing your funds in any financial asset or presented product or event. We are not responsible for your investing results.
Join Our Telegram channel to stay up to date on breaking news coverage