Join Our Telegram channel to stay up to date on breaking news coverage
Bitcoin Price Prediction – December 10
The Bitcoin price is hovering at $48,163 after touching the daily high of $50,148 at the beginning of today.
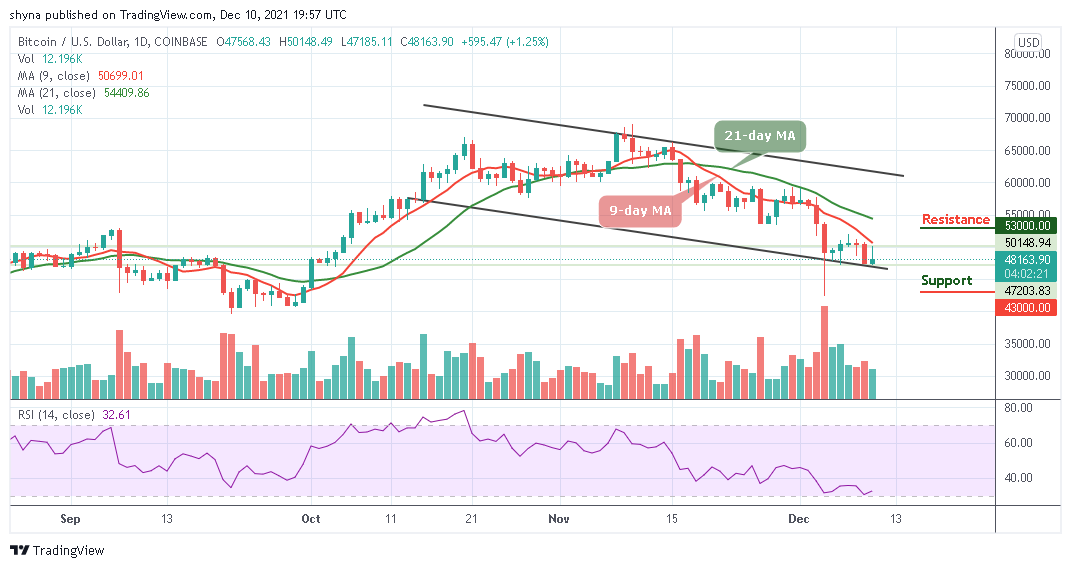
BTC/USD Long-term Trend: Bearish (Daily Chart)
Key levels:
Resistance Levels: $53,000, $55,000, $57,000
Support Levels: $43,000, $41,000, $39,000
At the time of writing, BTC/USD is seen facing the higher levels as the latest move marks an upwards break of the bullish phase, but it is important to note that it is yet to push the Bitcoin price above the key technical levels. Therefore, the Bitcoin price has been making an attempt to maintain the bullish movement since the European session but struggling to gain momentum at the moment.
Bitcoin Price Prediction: Bitcoin (BTC) Ready for Upwards?
The Bitcoin price is trading up above its opening price of $47,568. Although the current movement marks a slight climb from where it has been trading for the past few days. However, it is important to note that this current level could mark a bullish break above the 9-day moving average. More so, as the technical indicator Relative Strength Index (14) moves to cross above 35-level, the coin is likely to cross above the 9-day MA before facing the upside.
However, a continuous bullish movement of the Bitcoin price could locate the potential resistance at $52,000, reaching this may also allow for an extended recovery towards $53,000, $55,000, and $57,000 respectively. Moreover, if the technical indicator RSI (14) drops below the oversold region, the Bitcoin market may experience another downward movement which may force the Bitcoin price to cross below the lower boundary of the channel and could possibly hit the support levels at $43,000, $41,000, and $39,000.
BTC/USD Medium-Term Trend: Ranging (4H Chart)
Looking at the 4-hour chart, BTC/USD needs to stay above the 9-day and 21-day moving averages in other to mitigate the short-term bullish pressure and allow for an extended recovery towards $50,000. Therefore, a higher resistance level may be located at $51,000 and above.
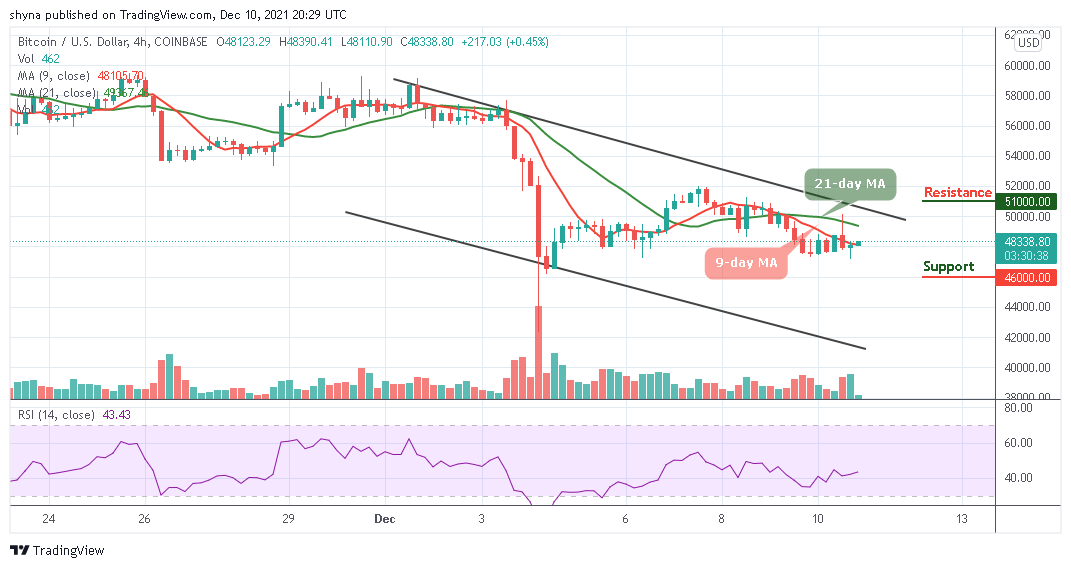
However, the Bitcoin price is seen likely to cross below the 9-day MA as a sustainable move below this barrier may increase the downside pressure to the support level of $46,000 and below. Meanwhile, the technical indicator Relative Strength Index (14) is moving above 40-level, as the signal line aims to cross above 45-level which may likely increase the bullish movement.
Looking to buy or trade Bitcoin (BTC) now? Invest at eToro!
68% of retail investor accounts lose money when trading CFDs with this provider
Read more:
Join Our Telegram channel to stay up to date on breaking news coverage