Join Our Telegram channel to stay up to date on breaking news coverage
Bitcoin Price Prediction – September 20
The daily chart reveals that the Bitcoin price prediction heads lower as the coin touches the low of $43,250.
BTC/USD Long-term Trend: Ranging (Daily Chart)
Key levels:
Resistance Levels: $50,000, $52,000, $54,000
Support Levels: $40,000, $38,000, $36,000
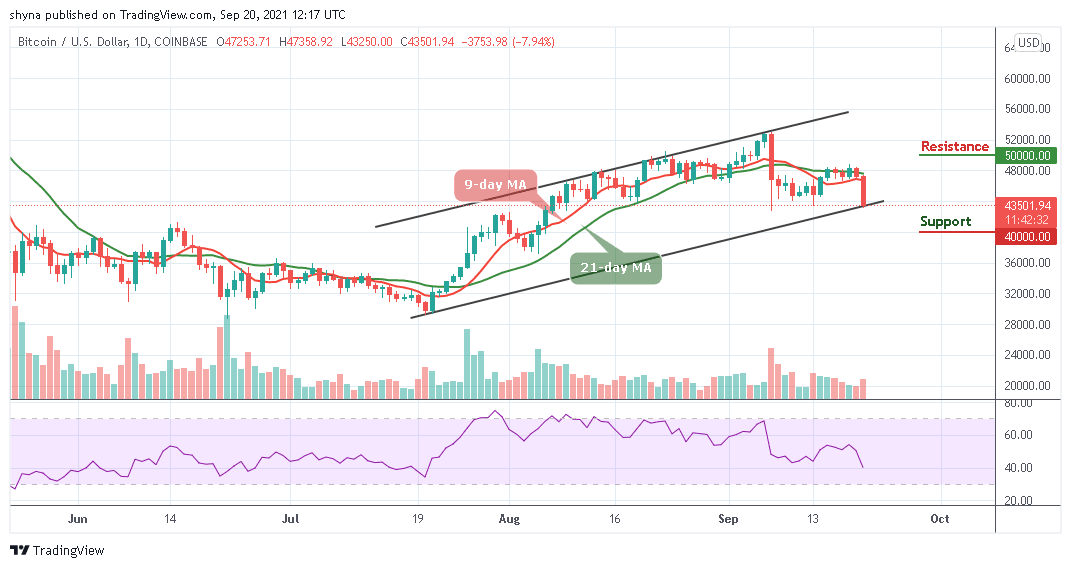
BTC/USD is experiencing another downtrend as the market price slides below the 9-day and 21-days moving averages. The Bitcoin price drop sharply to touch the support level of $43,250. Meanwhile, it is likely for a quick reversal to come to play if possible, which could send the king coin back to the opening price of $47,358 level.
Bitcoin Price Prediction: Bitcoin Price Ready for More Downtrends
The technical indicator Relative Strength Index (14) reveals that the Bitcoin price movement is currently bearish as the signal line prepares to cross below 40-level. Meanwhile, for the red-line of the 9-day MA to remain below the green-line of the 21-day MA, the king coin may continue to follow the downward movement. Moreover, this could mean that there may still be a room that could be explored by bears
However, recovery may not come easy for Bitcoin (BTC) as the price faces a downtrend but any attempt to cross below the lower boundary of the channel may push the coin towards the support levels of $40,000, $38,000, and $36,000. On the other hand, any bullish movement above the 9-day and 21-day moving averages could force the bulls to create a new trend towards the resistance levels of $50,000, $52,000, and $54,000.
BTC/USD Medium-Term Trend: Bearish (4H Chart)
On the 4-hour chart, the Bitcoin price keeps hovering at the downside as the coin couldn’t survive the $45,000 support while the market prepares for more downtrend by crossing below the lower boundary of the channel. However, the Bitcoin price is likely to continue to the bear market if the 9-day MA remains below the 21-day MA.
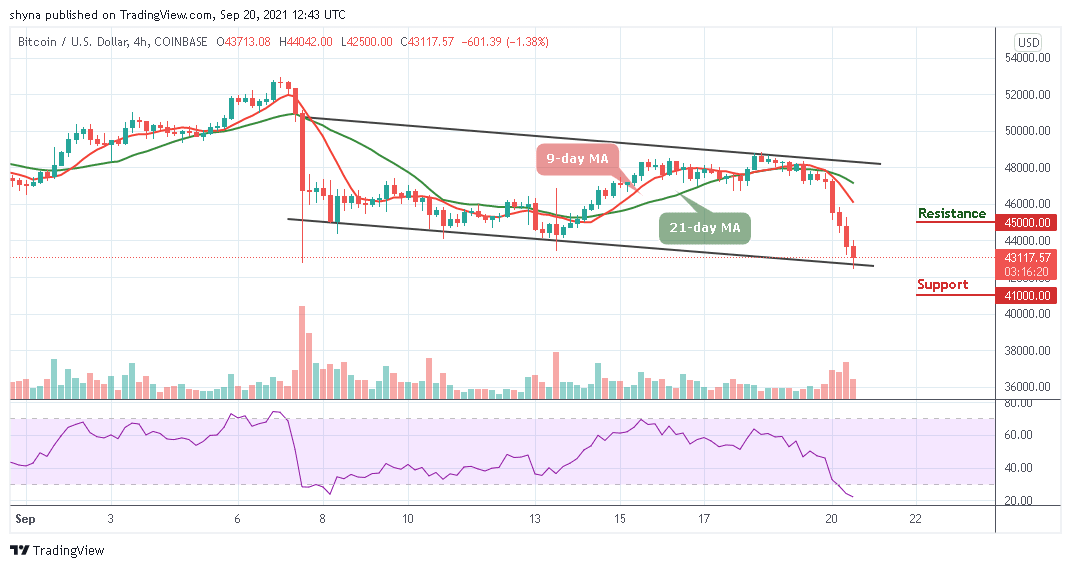
Therefore, if the price drops below the channel, even $42,000 support may not be able to hold the sell-off as the Relative Strength Index (14) moves into the oversold region. Therefore, the king coin is likely to hit the support of $41,000 and below but the resistance level could be found at $45,000 and above if the Bitcoin price moves up.
Looking to buy or trade Bitcoin (BTC) now? Invest at eToro!
67% of retail investor accounts lose money when trading CFDs with this provider
Read more:
Join Our Telegram channel to stay up to date on breaking news coverage