Join Our Telegram channel to stay up to date on breaking news coverage
Bitcoin (BTC) Price Prediction – February 27
The Bitcoin (BTC) bears are steadily pushing the price below $8,800 which is the critical technical support for the market.
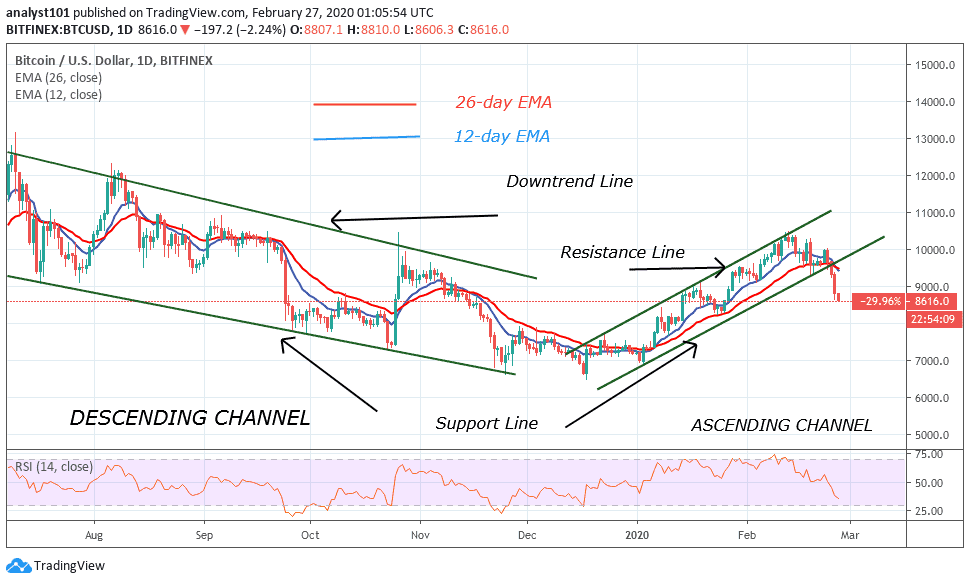
BTC/USD Long-term Trend: Bullish (Daily Chart)
Key levels:
Resistance Levels: $10,000, $10,200, $10,400
Support Levels: $7,800, $7,600, $7,400

BTC/USD has experienced an incredibly bearish price action in the past 24 hours, the cryptocurrency losing support below $8,800 and entering a downward trend as the bears try to erase much of the recent BTC gains. At the time of writing, Bitcoin is trading down over 0.70% at its current price of $8,790, which marks a notable decline from a daily high of $9,369 region and an intense drop from the weekly high of over $10,000.
However, the reason for the on-going sell-off seems to have been the cryptocurrency’s swift rejection at $10,000 that it faced this past weekend, which seems to confirm the bearish structure of the market which was developing as a result of its flash crash that was seen exactly a week ago. Following the short-term bearish scenario; the RSI (14) signal line is still below the 40-level and the next level of supports for Bitcoin lies at $7,800, $7,600 and $7,400.
Moreover, if the market can find mid-term support between the ranges of $9,300 – $8,700 area, traders can then expect insane price growth to the $10,000 and beyond. For now, there’s a need for a clear cross above the 9-day and 21-day moving averages that may push the price towards the resistance levels of $10,000, $10,200 and $10,400 before we can start to consider a bullish surge in Bitcoin’s price.
BTC/USD Medium – Term Trend: Bearish (4H Chart)
Looking at the 4-hour chart, the Bitcoin price is exchanging hands below the $8,800 for the first time since the beginning of February. If BTC/USD does not reverse upwards and gain ground above the moving averages, the sellers are likely to exert more pressure, forcing the bulls down a painful path towards $8,400, $8,200 and $8,000 support levels.
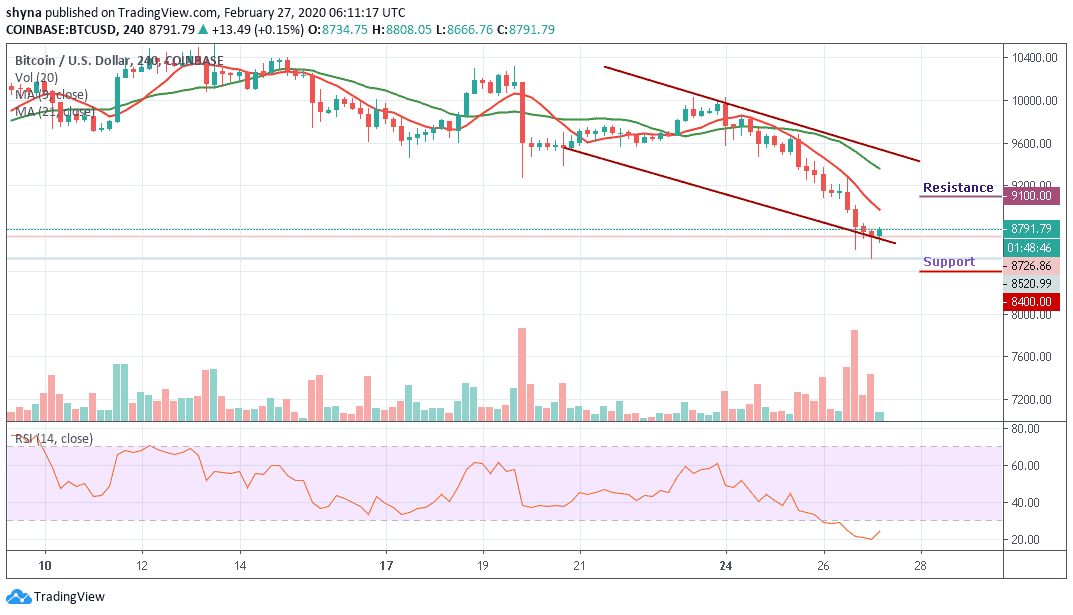
However, as the RSI (14) is making an attempt to move out of the oversold zone and to consider a possible bullish swing, we may need to see BTC/USD touches at $9,100, $9,300 and $9,500 resistance levels before we can start to feel a bullish comeback. In fact, a clear break above the $9,800 might give us a buy signal in the medium-term. Otherwise, the market will remain in a bearish condition.
Please note: Insidebitcoins.com is not a financial advisor. Do your research before investing your funds in any financial asset or presented product or event. We are not responsible for your investing results.
Join Our Telegram channel to stay up to date on breaking news coverage