Join Our Telegram channel to stay up to date on breaking news coverage
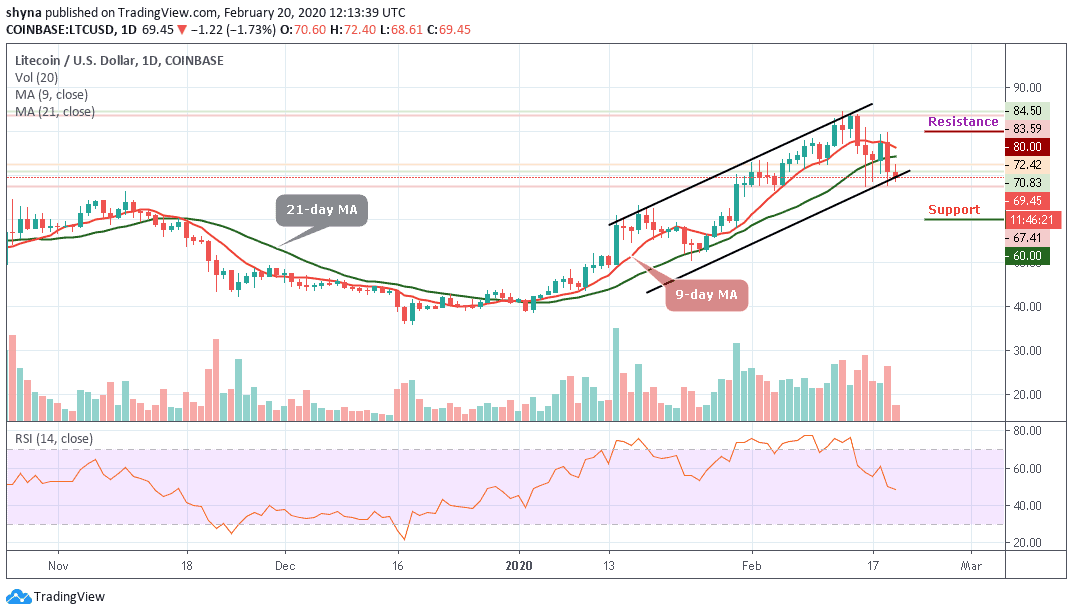
Bitcoin (BTC) Price Prediction – February 20
The Bitcoin price declined heavily below $9,800 and it is now vulnerable for a bigger correction.
BTC/USD Long-term Trend: Bullish (Daily Chart)
Key levels:
Resistance Levels: $10,700, $10,900, $11,100
Support Levels: $8,700, $8,500, $8,300
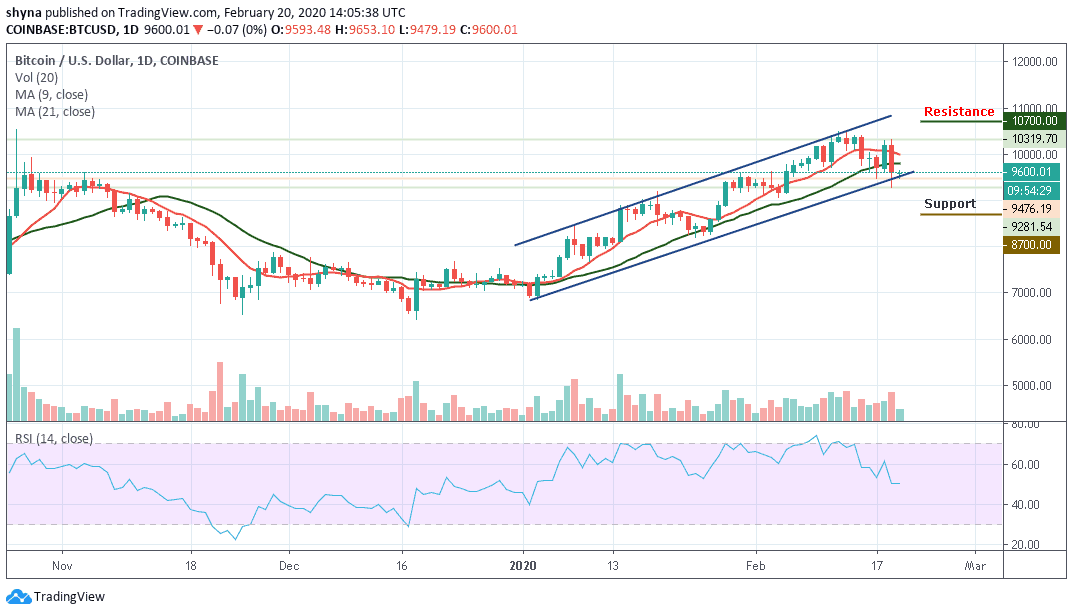
BTC/USD saw a sudden sell over the past 2 days as it dropped from a high of $10,319 to as low as $9,281. Though the coin is attempting to bounce back, the recent drop has pushed the momentum within the bearish favor and this could be the start of a further retracement lower.
Taking a look at the daily chart above, we can see that Bitcoin rolled over from the $10,319 resistance level as it started its descent lower. It initially dropped beneath the 9-day moving average at $10,000 but managed to find support below the 21-day moving average at $9,600 which allowed it to bounce back higher.
However, if the sellers continue to drag BTC/USD back beneath the support at $9,656, the first level of lower support is located at $9,300. Beneath this, the critical support lies at $8,700, $8,500 and $8,300. On the other hand, if the bulls bounce higher, the nearest resistance lies at $10,700, $10,900 and $11,100 levels.
Meanwhile, the RSI (14) is moving around the 50-level which shows that the market may likely follow a sideways movement. For a market recovery, traders will need to see the RSI (14) breaking back above the 50-level and upwards.
BTC/USD Medium – Term Trend: Ranging (4H Chart)
Since the beginning of today, BTC/USD has been trading within the range of $9,709 to $9,392 been revealed by the technical indicator RSI (14). Nevertheless, the coin has not yet slipped below $9,000 but still in the loop of making a bounce back. The Bitcoin price hovers around $9,644 and may take time to persistently trade above $9,800. The upward movement is facing hurdles near the $10,000 and $10,200 resistance level.
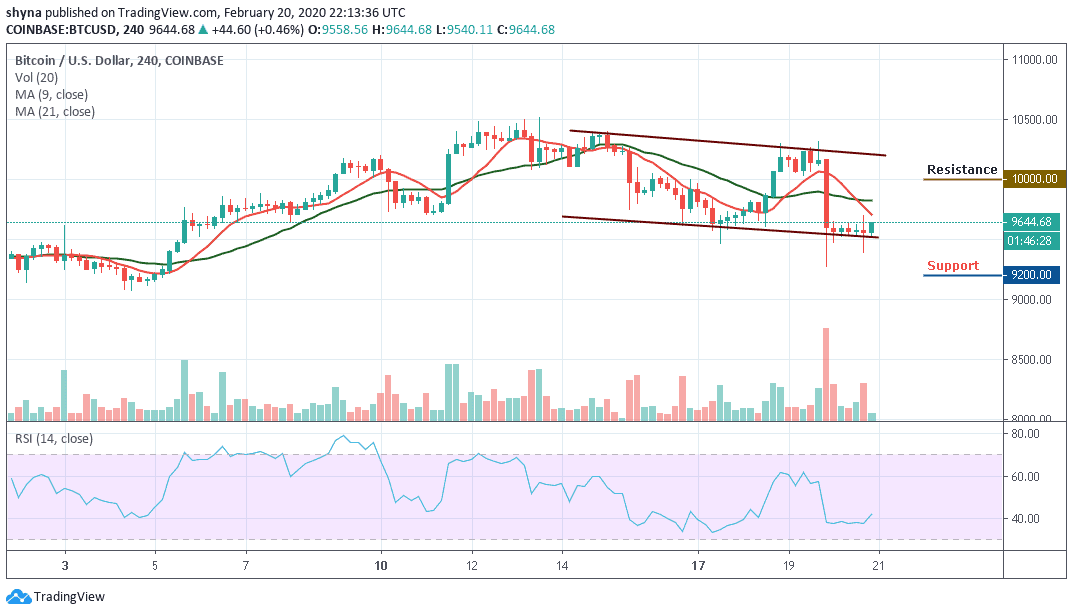
However, on the downside, immediate support is near the $9,500 level while the main support is at the $9,400 level. The price might slide sharply below $9,300 which may likely test the main support at $9,200 level and below. Technically, BTC/USD is poised for more losses in the near-term as the red-line of 9-day MA has crossed below the green-line of 21-day MA, indicating more bearish movement.
Please note: Insidebitcoins.com is not a financial advisor. Do your research before investing your funds in any financial asset or presented product or event. We are not responsible for your investing results.
Join Our Telegram channel to stay up to date on breaking news coverage