Join Our Telegram channel to stay up to date on breaking news coverage
Bitcoin Price Prediction – September 8
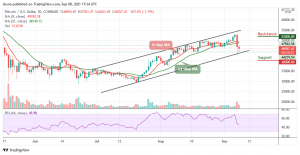
The Bitcoin price prediction reveals that BTC is seen struggling with the $46,000 support, currently down with 1.79%.
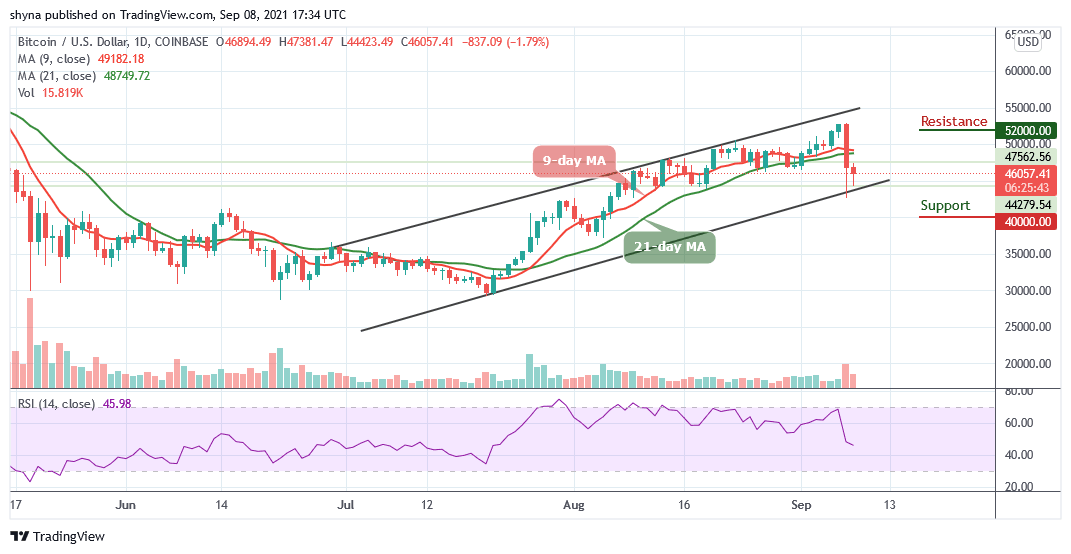
BTC/USD Long-term Trend: Bullish (Daily Chart)
Key levels:
Resistance Levels: $52,000, $54,000, $56,000
Support Levels: $40,000, $38,000, $36,000
BTC/USD may need to reclaim the ground above the resistance level of $50,000 as soon as possible, the reason being that more action is expected above this level and the longer Bitcoin (BTC) stays under the 9-day and 21-day moving averages, the stronger the bears get. Therefore, the support at $45,000 may not be enough to hold the intense pressure. In this case, BTC could refresh lows towards $42,000 support.
Bitcoin Price Prediction: Bitcoin (BTC) Not Ready for Upside
The daily chart shows that the Bitcoin price is not yet ready for the upside as the coin prepares for more downtrend. In the meantime, consolidation is likely to take precedence with support at $44,000, holding well. The technical indicator Relative Strength index (14) also puts emphasis on the possible downtrend action as the signal line moves below 50-level. The same situation may reflect by the moving averages if the green-line of 21-day MA crosses above the red-line of 9-day MA.
However, the next few days could be extremely crucial for Bitcoin’s price. Therefore, if the Bitcoin price fails to break above the 9-day and 21-day moving averages, the market price may move back below the $43,000 level or it may just sit between the $42,000 – $44,000 price range. However, the resistance levels are located at $52,000, $54,000, and $56,000 while the support levels may be found at $40,000, $38,000, and $36,000 respectively
BTC/USD Medium – Term Trend: Ranging (4H Chart)
Looking at the 4-hour chart, BTC/USD is seen on a downward move and the coin may continue to depreciate if the $46,000 support is broken. The 9-day MA is seen moving below the 21-day MA, with this, BTC/USD may drop more to hit the critical support level of $44,000 and below.
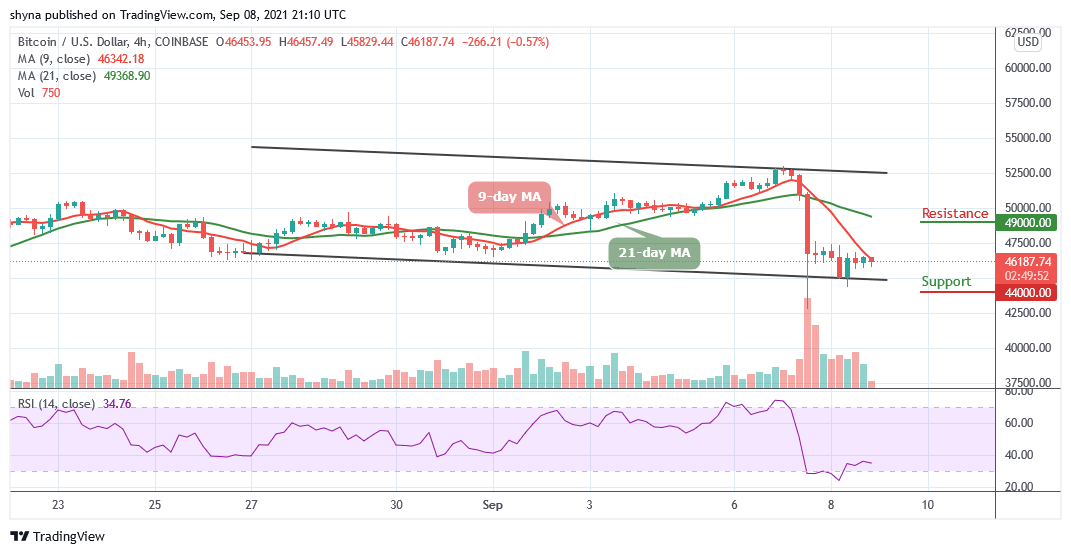
Meanwhile, if the bulls push the current price value above the 9-day MA, further bullish movement may take the Bitcoin price towards the potential resistance level of $49,000 and above. In other words, the technical indicator also shows that the Relative Strength Index (14) is currently moving in the same direction, suggesting sideways movement for the coin.
Looking to buy or trade Bitcoin (BTC) now? Invest at eToro!
67% of retail investor accounts lose money when trading CFDs with this provider
Read more:
Join Our Telegram channel to stay up to date on breaking news coverage