Join Our Telegram channel to stay up to date on breaking news coverage
Bitcoin Price Prediction – February 18
The Bitcoin price prediction shows that BTC keeps trading below the moving averages as the coin touches the daily low at $39,474.
BTC/USD Long-term Trend: Bearish (Daily Chart)
Key levels:
Resistance Levels: $45,000, $47,000 $49,000
Support Levels: $35,000, $33,000, $31,000

BTC/USD faces a setback as the king coin crosses below the 9-day and 21-day moving averages. However, the Bitcoin price is likely to have a bearish run in the long-term, but a price rally may help the coin to head to the south as the red line of the 9-day moving average is likely to cross below the green line of the 21-day moving average. Currently, Bitcoin (BTC) is trading around the $40,042 level after a free fall from $40,990 during the European session.
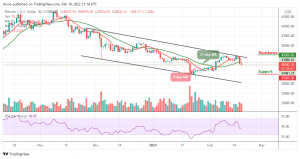
Bitcoin Price Prediction: Bitcoin (BTC) May Stay Below the Moving Averages
According to the daily chart, the Bitcoin price is currently nose-diving below the 9-day and 21-day moving averages. If the price should slump below the support level of $39,000, the king coin is likely to remain at the downside. However, the further bearish movement could locate the supports at $35,000, $33,000, and $31,000, making room for BTC to fall even further.
On the contrary, the technical indicator Relative Strength Index (14) shows that the coin may fall more as the signal line moves to cross below 40-level. Moreover, if the bulls decide to move the price back above the 9-day and 21-day moving averages, BTC/USD may likely cross above the upper boundary of the channel to locate the resistance levels at $45,000, $47,000, and $49,000.
BTC/USD Medium-Term Trend: Ranging (4H Chart)
On the 4-Hour chart, the Bitcoin price stays below the 9-day and 21-day moving averages, and the immediate support is likely to come below the lower boundary of the channel. However, the Bitcoin price may likely fall below this barrier if the bears fully stepped back into the market.
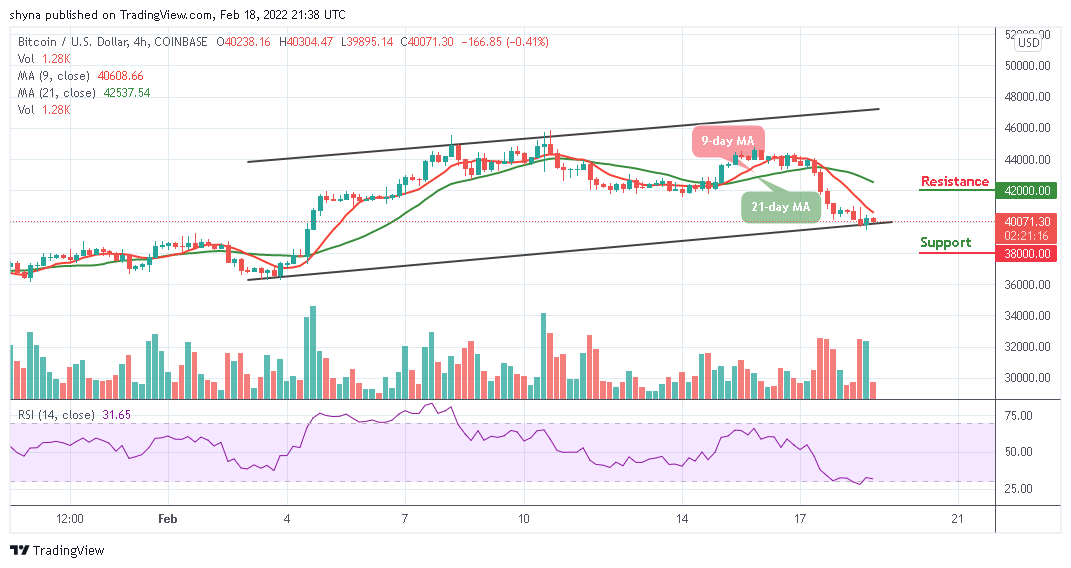
Moreover, a further bearish movement could touch the critical support at the $38,000 level and below while the resistance is located above the 9-day and 21-day moving averages at the resistance level of $42,000 and above. Looking at the technical aspect of it, Bitcoin (BTC) is currently moving into the negative side as the technical indicator Relative Strength Index (14) may cross into the oversold region.
Looking to buy or trade Bitcoin (BTC) now? Invest at eToro!
68% of retail investor accounts lose money when trading CFDs with this provider
Read more:
Join Our Telegram channel to stay up to date on breaking news coverage