Join Our Telegram channel to stay up to date on breaking news coverage
Bitcoin (BTC) Price Prediction – December 30
The price of Bitcoin is trading in a tight range between $7,002.89 and $7,691.76 for the past few days.
BTC/USD Long-term Trend: Ranging (Daily Chart)
Key levels:
Resistance Levels: $7,800, $8,000, $8,200
Support Levels: $6,800, $6, 600, $6,400
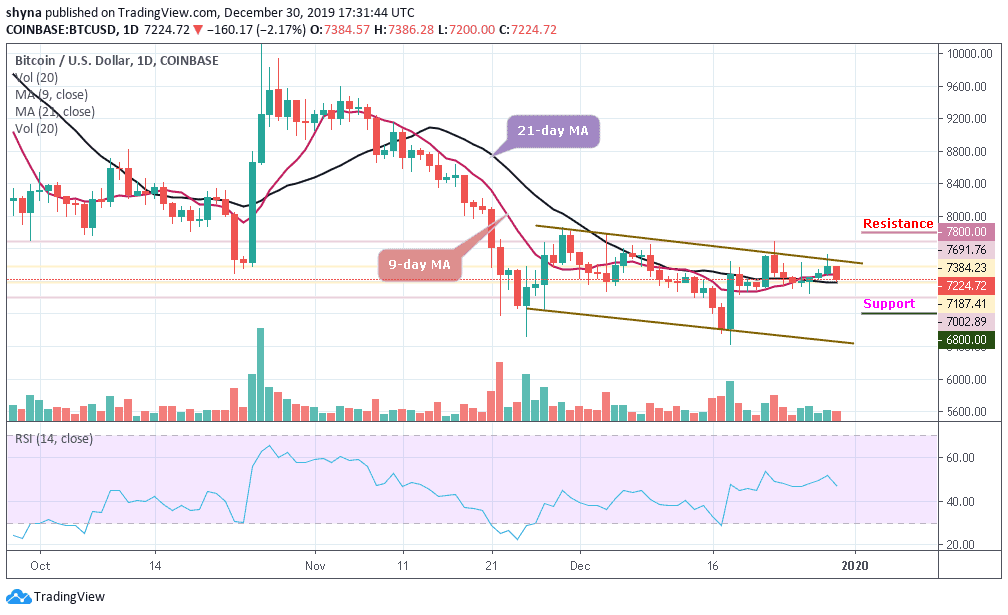
Bitcoin has not been able to recover from a significant upsurge to end the year with a bullish note. Over the past month, the trend of BTC/USD has shown many price fluctuations. However, the price has traded between $7002 and $7691. With no signs of significant growth in the near future, BTC/USD is down with 2.17% within the last 24 hours.
Moreover, BTC/USD hit the low at $7,064 on December 27 and has been recovering ever since. The first digital coin tested area above $7,500; however, the upside momentum was not strong enough for the price to stay above critical resistance level strengthened by the 9-day and 21-day moving averages on a daily chart. Once it is out of the way, the upside is likely to gain traction with the next focus on the resistance levels of $7,800, $8,000 and $8,200 located above the channel.
Meanwhile, if the market decides to go down, Bitcoin’s price may drop to $6,900 and should this support fails to contain sell-off, we may see a further drop to $6,800, $6,600 and potentially $6,400. The RSI (14) for Bitcoin price moves below the 50-level and turning downward, the market may fall to immediate supports.
BTC/USD Medium – Term Trend: Bearish (4H Chart)
Following the 4-hour chart, Bitcoin bears have now taken control and pushed the BTC price below its previous support level that existed around $7,200. Although, the Bitcoin price has not yet slipped below $7,000 and it’s still in the loop of making a bounce back. Its price hovers around $7,220.02 and may take time to persistently trade above $7,400.
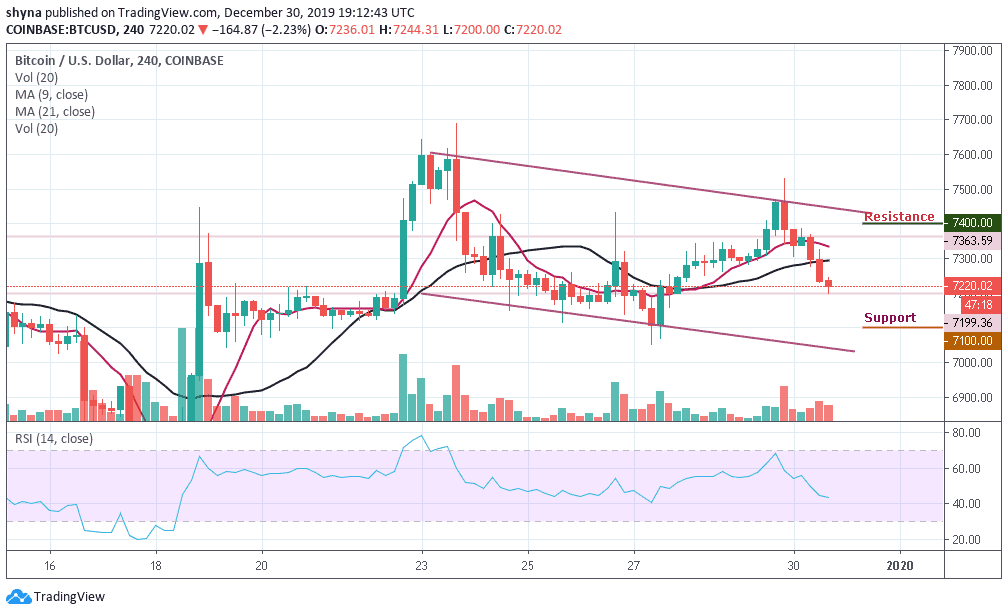
Nevertheless, BTC/USD is currently moving below the 9-day and 21-day moving averages and any upward movement may likely push the price near the $7,400, $7,450 and $7,500 resistance levels while the immediate support lies at $7,100, $7,050 and $7,000. The RSI (14) nosedives to 40-level, which may likely give more bearish signals before a reversal could play out.
Please note: Insidebitcoins.com is not a financial advisor. Do your research before investing your funds in any financial asset or presented product or event. We are not responsible for your investing results.
Join Our Telegram channel to stay up to date on breaking news coverage