Join Our Telegram channel to stay up to date on breaking news coverage
Bitcoin Price Prediction – June 23
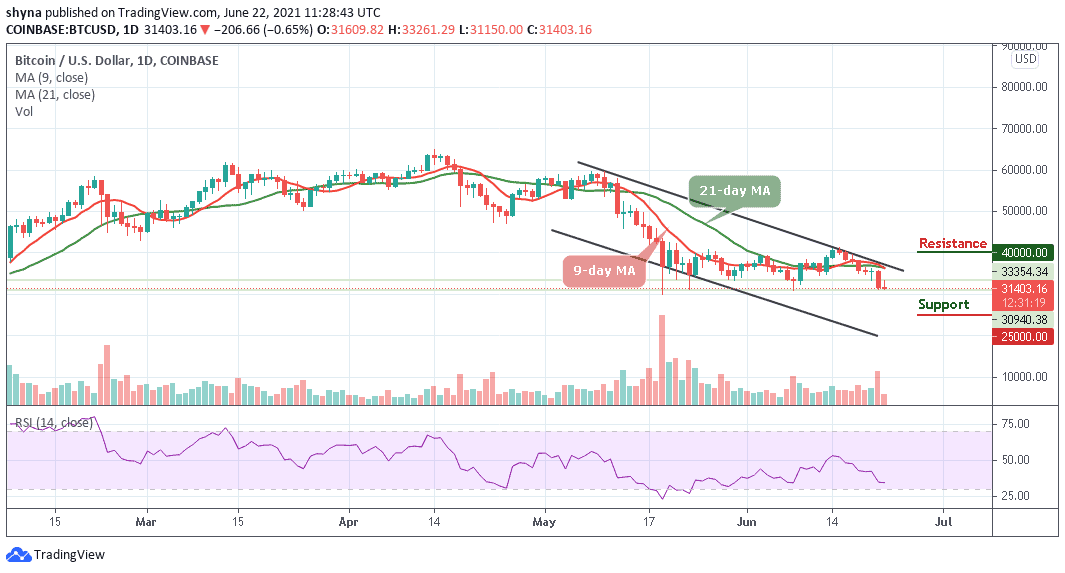
The Bitcoin price is trying to hold above the $34,000 but overhead pressure from the bears continues to make this task a difficult one for the bulls.
BTC/USD Long-term Trend: Bearish (Daily Chart)
Key levels:
Resistance Levels: $40,000, $42,000, $44,000
Support Levels: $27,000, $25,000, $23,000
At the time of writing, BTC/USD is seeking support above $34,000 to avoid extending the bearish leg to $28,000. But as it is, the Bitcoin price may still continue with the downtrend as the red-line of the 9-day moving average is about crossing below the green-line of the 21-day moving average. Alternatively, the BTC bulls need to find acceptance above the intraday highs of $34,881 to refuel the recovery momentum.
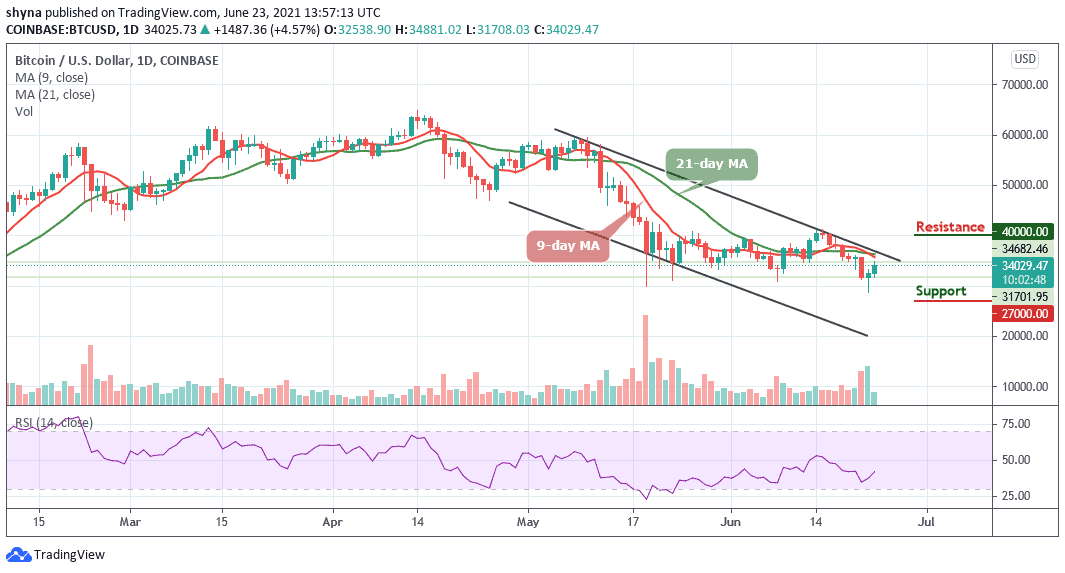
Bitcoin Price Prediction: Would Bitcoin Price Stay Above $34k?
The Bitcoin price is hovering at $34,029 as it is currently attempting an upside break towards the 9-day and 21-day moving averages and a close above $34,000 resistance could open the doors for a larger increase in the coming positive moves. In the past few days, Bitcoin price traded in a range above the $29,000 support zone. However, BTC/USD is currently moving higher towards the $34,000 level and the next key resistance level may be found at 38,000, above which the bulls are likely to hit the potential resistance at $40,000, $42,000, and $44,000 in the near term.
On the other hand, if there is no clear break above $34,000, there are chances of a fresh decline. However, as the 9-day MA stays below the 21-day MA, the coin may stay within the negative side and initial support is near the $31,000 level. The main support may be forming near the $30,000 level, below which the price could dive towards the supports of $27,000, $25,000, and $23,000 as the technical indicator Relative Strength Index (14) moves above the 40-level.
BTC/USD Medium – Term Trend: Bearish (4H Chart)
On the 4-hour chart, a retest of $34,000 gives the impression that bulls are not yet done. The Bitcoin price rises to fill a significant gap as the bulls remained in control which may take the coin towards the $35,000. However, the Bitcoin price may hit the $35,000 level if the bullish pressure continues. If not, the king coin may revisit the support level of $32,000 and below.
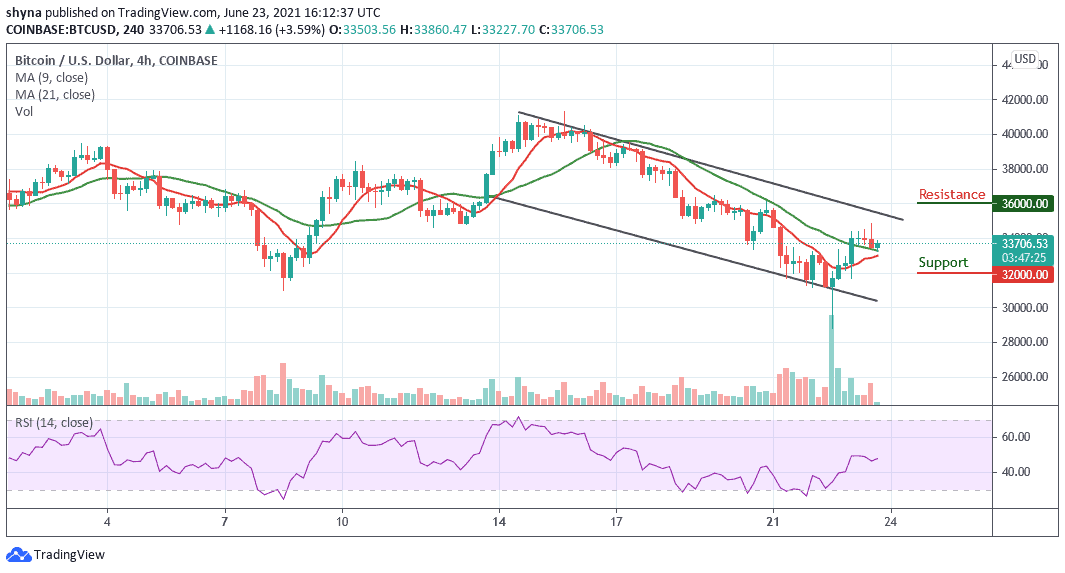
On the upside, a further bullish move may hit the resistance at $36,000 and above. As of now, the Relative Strength Index (14) is moving above 45-level, this could mean that the BTC/USD trading is looking for another close resistance and a significant cross below the moving averages may send the market in a bearish scenario.
Looking to buy or trade Bitcoin (BTC) now? Invest at eToro!
75% of retail investor accounts lose money when trading CFDs with this provider
Join Our Telegram channel to stay up to date on breaking news coverage