Join Our Telegram channel to stay up to date on breaking news coverage
Bitcoin (BTC) Price Prediction – December 25
At the time of writing, the BTC/USD price resorts back to its stable momentum and trades at $7,231.
BTC/USD Long-term Trend: Bearish (Daily Chart)
Key levels:
Resistance Levels: $7,800, $8,000, $8,200
Support Levels: $6,600, $6, 400, $6,200
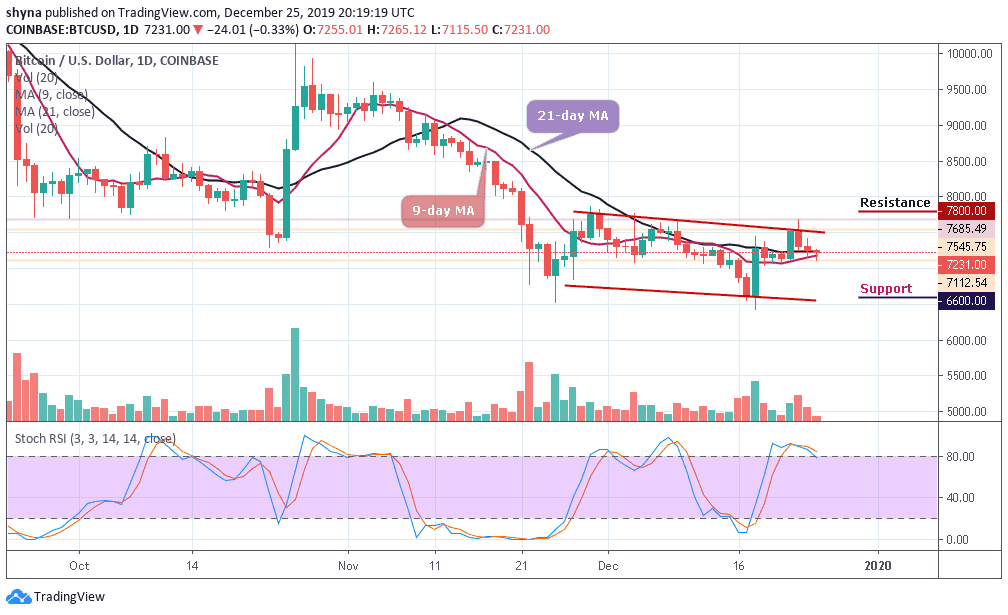
A few days ago, BTC/USD started an upward trend and faced a key resistance of $7,700. The coin was later rejected and is now trading around the 9-day and 21-day moving averages. With the look of things, if BTC/USD continued to consolidate in this way, we could soon see it break below the moving averages and it would then be obvious to target $7,100. More so, we could see a larger decline over the next two days if the downtrend continues to form in a pattern formation.
Meanwhile, the market has remained in the consolidation mode at the middle boundary of the channel, deciding on the next move. However, it can be expected that the market will continue to sell as soon as the declines come together. If the bulls show a strong commitment, the BTC/USD could rise to the critical resistance levels of $7,800, $8,000 and $8,200. The stochastic RSI is at the overbought but may be coming down soon.
Looking at the daily chart, BTC/USD attempted to develop a recovery but failed to break out of the channel limited to $7,545 on the upside. Weak upward momentum affected the Bitcoin bulls, although bears should be able to push the price towards $6,800 to increase the chances of a downward scenario which may lead the price to $6,600, $6,400 and $6,200 levels in the next downward period.
BTC/USD Medium – Term Trend: Bearish (4H Chart)
Looking at the 4-hour chart, Bitcoin’s price is currently trading around $7,242 and around the 9-day moving average after rebounding from $7,174 where the market started trading today. Meanwhile, we can see that the bullish supply is coming up gradually in the market while the bears are also trying to drag the price down.
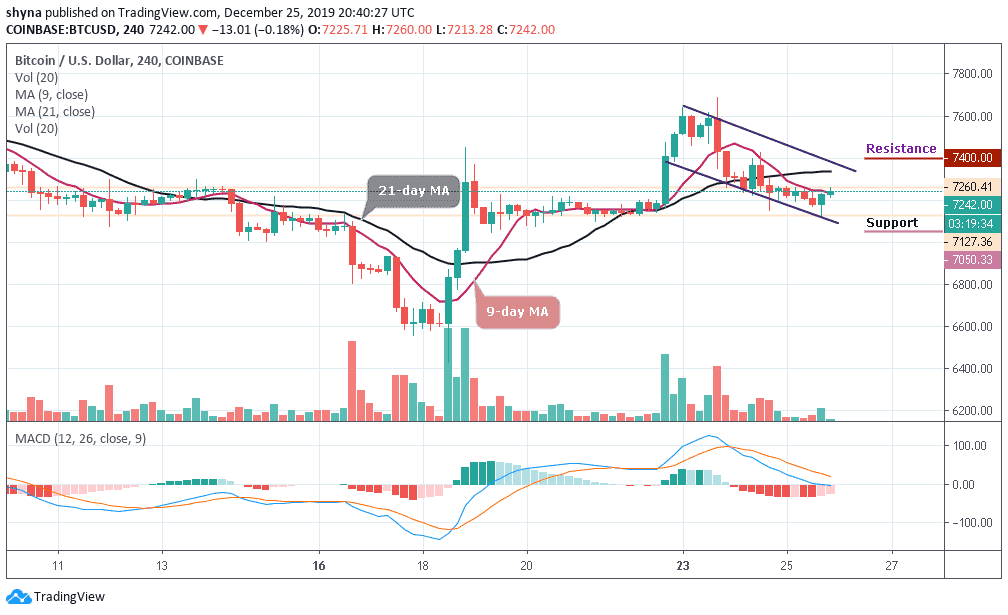
However, if the buyers can strengthen and energize the market, they can further push the price to a $7,350 resistance level. Therefore, breaking the mentioned resistance could also allow the bulls to test the $7,400 and above. Inversely, the MACD is preparing to cross into the negative side and when this is done, the bears may step back to drag the price to the support level of $7,050 and below.
Please note: Insidebitcoins.com is not a financial advisor. Do your research before investing your funds in any financial asset or presented product or event. We are not responsible for your investing results.
Join Our Telegram channel to stay up to date on breaking news coverage