Join Our Telegram channel to stay up to date on breaking news coverage
Bitcoin Price Prediction – December 21
The Bitcoin price prediction shows that BTC is trading nicely above the $48,000 as it needs to climb above the $49,000 resistance to continue higher.
BTC/USD Long-term Trend: Bearish (Daily Chart)
Key levels:
Resistance Levels: $55,000, $57,000, $59,000
Support Levels: $42,000, $40,000, $38,000
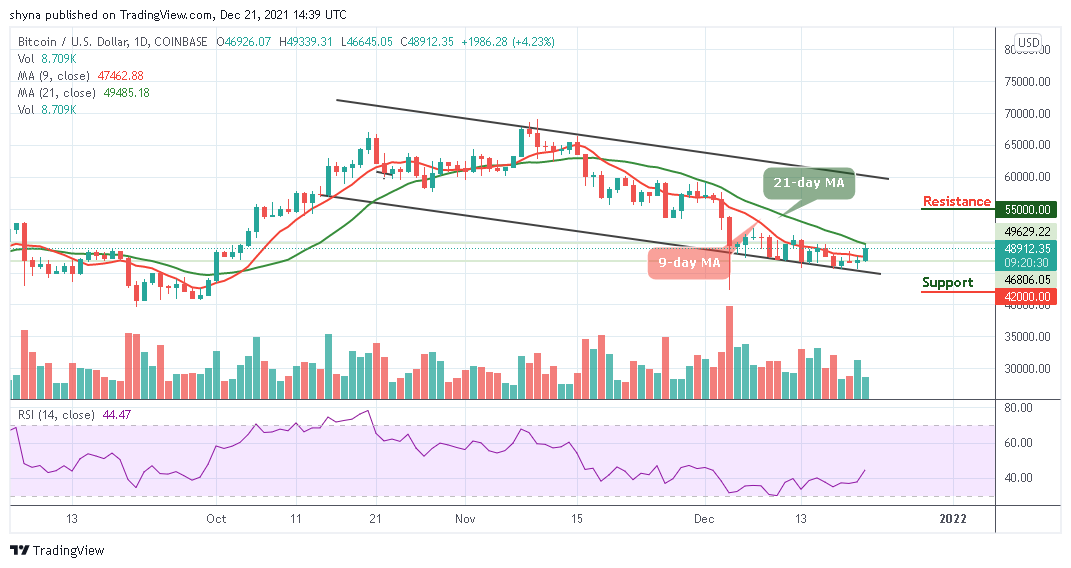
BTC/USD begins the day with a good recovery as the coin touches the daily high of $49,339 in the early hours of today. BTC/USD may continue to improve as the bulls could move it out of the downside to the upside. However, within the next few days for the year to runs out, BTC/USD may move to hit the resistance level of $70,000 if the buyers regroup.
Bitcoin Price Prediction: Bitcoin (BTC) Warming Up for the upside
The Bitcoin price is seen moving above the crucial levels which could function as the support zones in the event a reversal occurs. The king coin is making an attempt to cross above the 21-day moving average after crossing above the 9-day moving average. Meanwhile, on the upside, as the coin moves toward the upside, little is in place to prevent correction targeting the key resistance of $50,000 as the technical indicator Relative Strength index (14) moves above 40-level.
Nevertheless, if the market decides to go down, the Bitcoin price may drop below the 9-day moving average and should this barrier fails to contain the sell-off; traders may see a further drop to the supports at $42,000, $40,000, and critically $38,000. However, the potential resistance levels are located at $55,000, $57,000, and $59,000 respectively.
BTC/USD Medium – Term Trend: Ranging (4H Chart)
Looking at the 4-hour chart, the Bitcoin price is currently trading around $48,755 and above the 9-day and 21-day moving averages. Meanwhile, traders can see that the bullish supply is coming up slowly in the market while the bears are also trying to pull the price down.
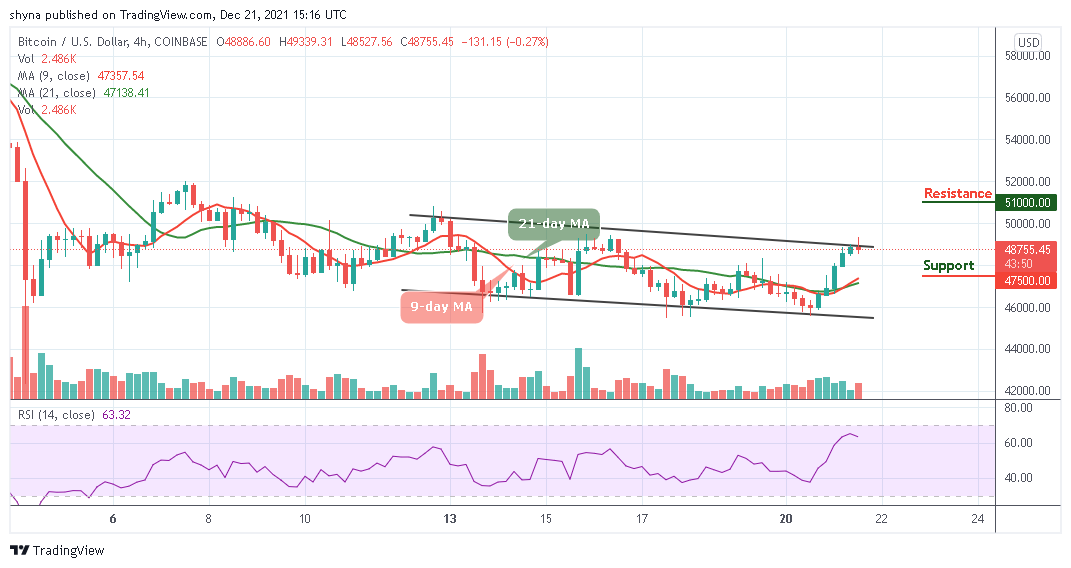
However, if the buyers could strengthen and energize the market, they can further push the price to a $50,000 resistance level. Therefore, breaking the mentioned resistance could also allow the bulls to test the resistance level of $51,000 and above. Meanwhile, the Relative Strength Index (14) is currently above 60-level, any bearish movement may welcome the sellers back into the market which could drag the price to the support level of $47,500 and below.
Looking to buy or trade Bitcoin (BTC) now? Invest at eToro!
68% of retail investor accounts lose money when trading CFDs with this provider
Read more:
Join Our Telegram channel to stay up to date on breaking news coverage