Join Our Telegram channel to stay up to date on breaking news coverage
Bitcoin Price Prediction – July 25
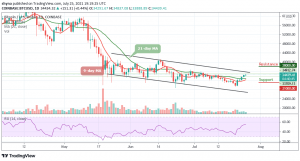
As the daily chart reveals, the Bitcoin price prediction is moving near the resistance level of $35,000 as the recovery comes slowly.
BTC/USD Long-term Trend: Bearish (Daily Chart)
Key levels:
Resistance Levels: $38,000, $40,000, $42,000
Support Levels: $31,000, $29,000, $27,000

At the time of writing, BTC/USD is seen trading at $34,439 after soaring to $34,837 in the early hour of today. The Bitcoin price is also seen pulling back to where it is currently trading and May likely head downwards if the bears step back into the market.
Bitcoin Price Prediction: Bitcoin Price Could Push Higher
For Bitcoin price to continue pushing higher, it is important for bulls to remains above the 9-day and 21-day moving averages. The 9-day MA is about to cross above the 21-day MA as the technical indicator Relative Strength Index (14) is sending moderate signs where an oscillation to the higher boundary may confirm the proper trend which is more likely a bullish trend at the time of the outcome.
However, BTC/USD may confirm the bullish trend if the market price moves above the previous high of $34,800. Meanwhile, the Bitcoin price could follow the bearish trend if the price cross below the 9-day and 21-day moving averages. Should this happen, the king coin may drop to the critical supports of $31,000, $29,000, and $27,000. As the technical indicator Relative Strength Index (14) moves above 55-level, a strong bullish spike may push the price towards the resistance levels of $38,000, $40,000, and $42,000.
BTC/USD Medium-Term Trend: Ranging (4H Chart)
Looking at the 4-Hour chart, Bitcoin (BTC) has not yet slipped below the 9-day and 21-day moving averages and the coin is still in the loop of making a bounce back. The Bitcoin price hovers above the 9-day and 21-day moving averages and may likely take time to trade above the upper boundary of the channel. At the moment, the Bitcoin price is currently moving around the $34,390 level.

However, if bulls put more effort, the market price may likely hit the resistance levels of $36,000 and above. On the other hand, if bears hold the price and drag it downward, the support level of $33,000 and below may be re-visited again but the Relative Strength Index (14) is likely to move above 70-level, indicating a possible bullish movement.
Looking to buy or trade Bitcoin (BTC) now? Invest at eToro!
75% of retail investor accounts lose money when trading CFDs with this provider
Join Our Telegram channel to stay up to date on breaking news coverage