Join Our Telegram channel to stay up to date on breaking news coverage
Bitcoin (BTC) Price Prediction – April 3
At the moment, BTC/USD dropped by a total of 0.65% within 24 hours as it trades at the $6,760 level.
BTC/USD Long-term Trend: Bullish (Daily Chart)
Key levels:
Resistance Levels: $7,800, $8,000, $8,200
Support Levels: $5,800, $5,600, $5,400
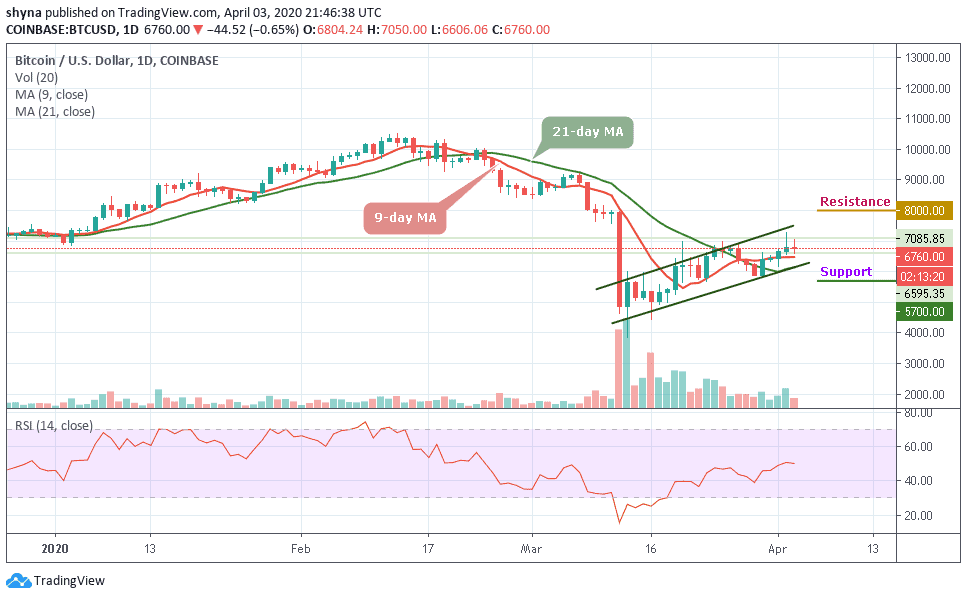
The daily chart reveals that BTC/USD failed to break the upper boundary of the ascending channel with the current consolidation pattern once again as it fails to close above the $6,800 level. The Bitcoin (BTC) started the day off by trending higher toward the $7,000 level only to roll over and fall lower to trade back inside the channel. Similarly, the first level of support is located at $6,300. Beneath this, support lies at $5,700, $5,500 and $5,300 levels.
However, this marks the second day in a row that Bitcoin has failed to break above this ascending channel as it looks to set up another few days of negative price declines beneath $6,800. A break above this channel would have set Bitcoin up to reach the $8,000 level; however, this is looking less and less likely with each failed breakout attempt as the RSI (14) moves around 50-level.
Furthermore, we can clearly see Bitcoin failing to break up above the upper boundary of this ascending channel. Today, it went as high as $7,085 but went on to roll over and drop back beneath the $6,800 level. Although the candle is still yet to close, however, it does look unlikely that the bulls may end up closing above this resistance. More so, toward the upside, resistance lies at $8,000, $8,200, and $8,400.
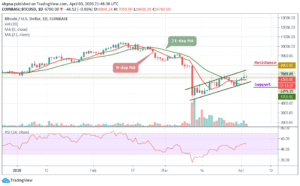
BTC/USD Medium-Term Trend: Bullish (4H Chart)
The 4-hour chart shows that the Bitcoin bears are now stepping back into the market pushing the BTC price below its previous support level that existed around $6,707. Although the Bitcoin price has not yet slipped below $6,500, it’s still in the loop of making a bounce back. Its price hovers around $6,732.09 and may take time to persistently trade above $6,800.

At the moment, BTC/USD is currently moving below the 9-day moving average but still the above 21-day moving average. The upward movement may likely push the price nearest resistance at $7,200, $7,400 and $7,600 resistance levels while the immediate support lies at $6,300, $6,100 and $5,900. The RSI (14) moves below the 57-level, which indicates more bearish signals.
Please note: Insidebitcoins.com is not a financial advisor. Do your research before investing your funds in any financial asset or presented product or event. We are not responsible for your investing results.
Join Our Telegram channel to stay up to date on breaking news coverage