Join Our Telegram channel to stay up to date on breaking news coverage
Bitcoin (BTC) Price Prediction – December 7
After Bitcoin bulls reclaimed the $7,400 level yesterday, the coin is holding in the $7,500 level and it may likely surge into the $8,000 area before plunging again.
BTC/USD Long-term Trend: Bullish (Daily Chart)
Key levels:
Resistance Levels: $8,000, $8,200, $8,400
Support Levels: $6,800, $6, 600, $6,400

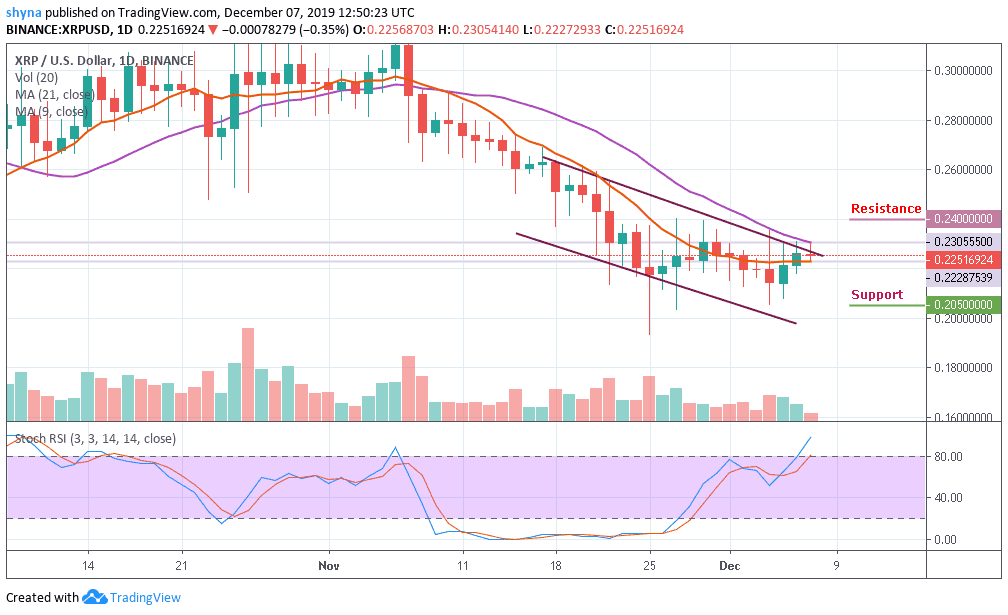
The journey of Bitcoin through this year 2019 has been extremely volatile; the coin started at $3,000 and reached a high of $13,800. Bitcoin’s price seems to be stuck in the $7,000 range for more than two weeks and the pattern formed since then has been indicating an incoming bearish move. More so, BTC/USD is in an ascending channel forming higher highs and higher lows. Therefore, since the price is at the end of the channel, it indicates that a breakout may likely come to play.
However, if the price of Bitcoin (BTC) declines below the ascending channel at this point, we can expect it to decline back into the lower boundary of the Bollinger bands. It is important to note that a few weeks ago, BTC/USD was bearish and not bullish. It is not a good sign for the cryptocurrency market. During that time, the price of Bitcoin (BTC) crashed hard. If the same were to happen again, we can expect the price of Bitcoin (BTC) to invalidate this ascending channel and fall down to the bottom of the previously broken Bollinger bands to potentially form a double bottom before any reversal.
Nevertheless, if the market drives below the $7,200 support, the BTC price may likely see support levels at $6,800, $6,600 and $6,400, bringing the price to a new low. Meanwhile, a strong buying pressure may take the price to $7,800 resistance. While trading at that level, a bullish continuation may likely reach the resistance levels of $8,000, $8,200 and $8,400 as the stochastic RSI is entering into the overbought zone.
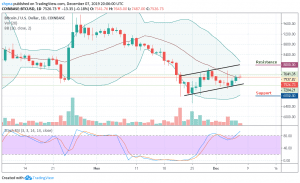
BTC/USD Medium – Term Trend: Ranging (4H Chart)
BTC/USD trades within the range of $7,544 to $7,519. Nevertheless, Bitcoin has not yet slipped below $7,000 and is still in the loop of making a bounce back. BTC price hovers around $7,524 and may take time to persistently trade above $7,800. The upward movement is facing hurdles near the $7,600 and $7,800 resistance level.
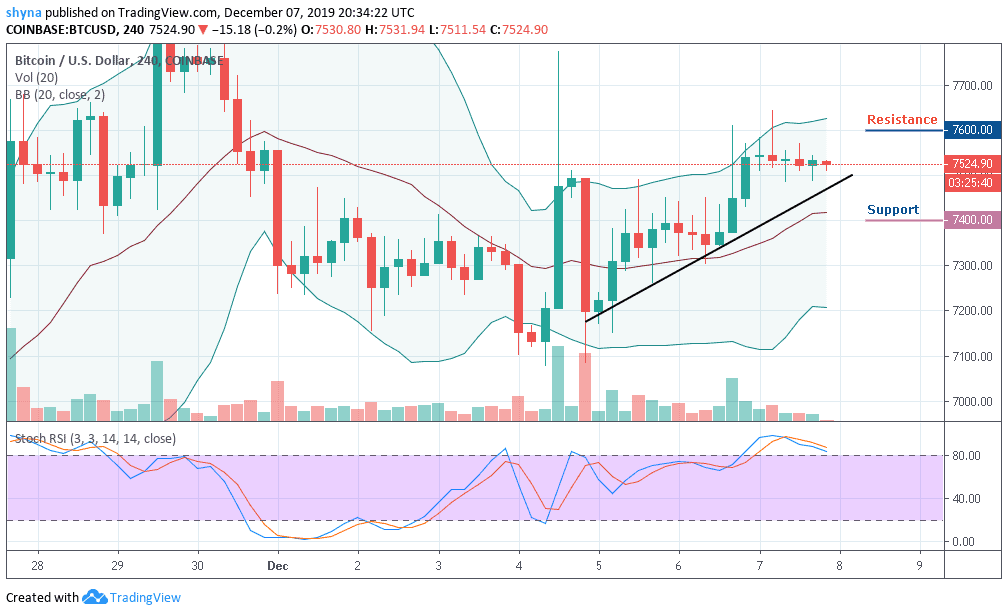
However, on the downside, immediate support is near the $7,450 level while the main support is at the $7,400 level. The price might slide sharply below $7,350 which may likely test the main support at $7,300 level. Technically, Bitcoin is poised for more losses in the near-term as the stochastic RSI is currently moving within overbought, indicating a reversal for the bearish movement.
Please note: Insidebitcoins.com is not a financial advisor. Do your research before investing your funds in any financial asset or presented product or event. We are not responsible for your investing results.
Join Our Telegram channel to stay up to date on breaking news coverage