Join Our Telegram channel to stay up to date on breaking news coverage
Bitcoin (BTC) Price Prediction – May 2
BTC/USD is on track for having a second bullish day in a row as the bulls took the price up from $8,600 to $8,986.
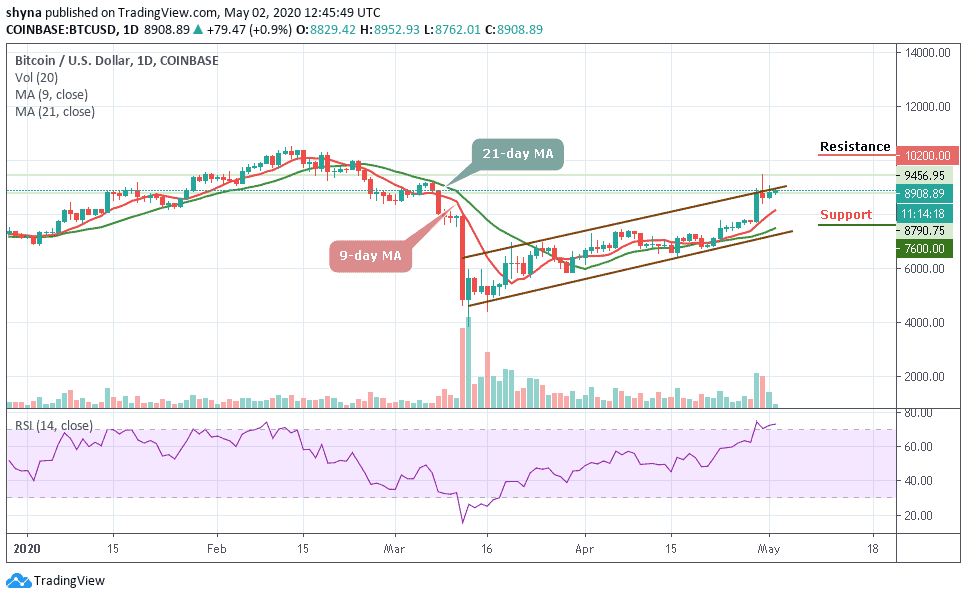
BTC/USD Long-term Trend: Bullish (Daily Chart)
Key levels:
Resistance Levels: $10,300, $10,500, $10,700
Support Levels: $7,500, $7,300, $7,100
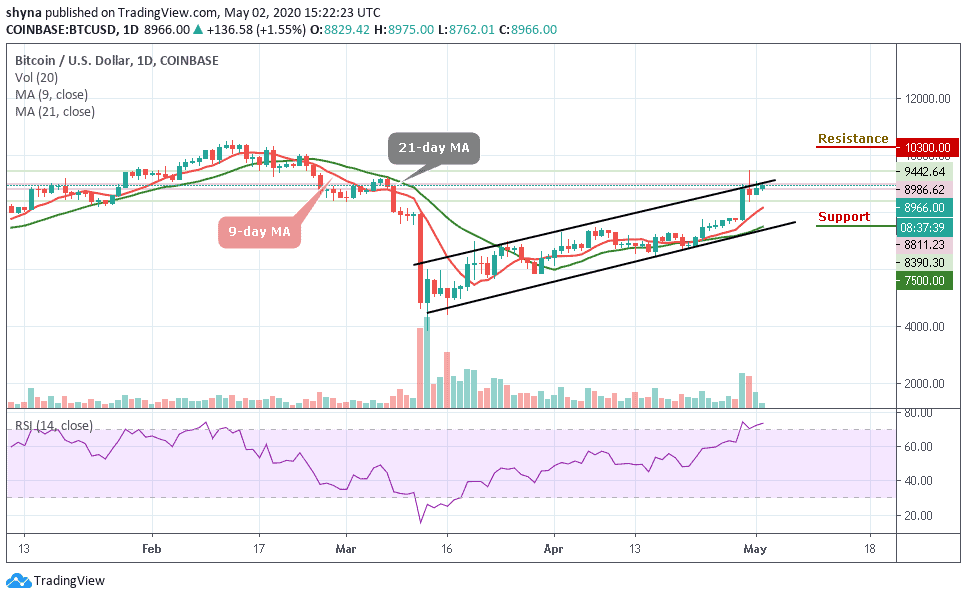
The bulls are intentional about finding higher support for BTC/USD. This battle comes after the coin tried and failed to extend gains past $9,442 which happens to be the last month high. The Bitcoin price is back under $9,000 and currently exchanging hands at $8,966. More so, the coin is also seen trading above the 9-day and 21-day moving averages.
Meanwhile, as long as the 9-day remains above the 21-day MAs, traders can expect BTC to consolidate at higher levels. That’s if we could see a further climb above the $9,000 which is fast approaching; it may likely reach the resistances at $10,300, $10,500, and $10,700. Nevertheless, the critical support level to watch for lies at $7,500, $7,300, and $7,100 respectively.
Currently, the Bitcoin price follows a dominant bullish bias. A glance at the technical indicator RSI (14) displays a positive picture of the coin in the near-term. Besides, maintaining a gradual upward slope in the overbought zone, the technical indicator is increasing as a signal for growing buying entries.
BTC/USD Medium-Term Trend: Ranging (4H Chart)
The 4-hour chart reveals that BTC/USD trades within the range of $8,604 to $9,067. Although the pair have not yet slipped below $8,800 since the opening of the market today and the coin is in the loop of making a bounce back. Currently, the Bitcoin (BTC) is trading around $8,927 and may likely trade above $9,000 level before the end of the day. The further bullish movement could reach $9,500 and above.
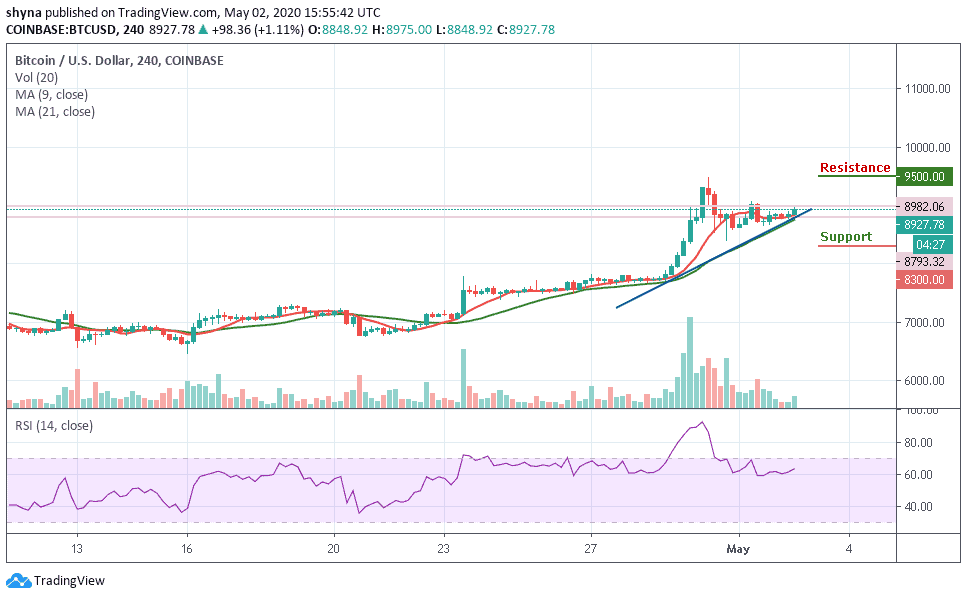
Nevertheless, the immediate support is around the $8,500 level while the main support is located at the $8,400 level. If these supports failed, the coin may likely hit the critical support at $8,300 and below. Technically, Bitcoin is currently moving in sideways as the RSI (14) moves around 64-level.
Please note: Insidebitcoins.com is not a financial advisor. Do your research before investing your funds in any financial asset or presented product or event. We are not responsible for your investing results.
Join Our Telegram channel to stay up to date on breaking news coverage