Join Our Telegram channel to stay up to date on breaking news coverage
Bitcoin Price Prediction – October 21
The Bitcoin price drop today as the cryptocurrency breaks beneath $63,000 and heads toward $62,000.
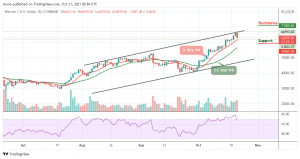
BTC/USD Long-term Trend: Bullish (Daily Chart)
Key levels:
Resistance Levels: $71,000, $73,000, $75,000
Support Levels: $59,000, $57,000, $55,000

BTC/USD is seen dropping with a loss of 5.03% as the cryptocurrency falls beneath the $62,500 support level to reach the daily low at $62,070. However, the daily chart reveals that $62,000 is a very important area as it provided strong resistance for the market a couple of days ago; therefore, it is expected to provide strong support moving forward.
Bitcoin Price Prediction: Bitcoin Price Could Fall More
The Bitcoin price is currently trading towards the 9-day moving average within the channel. However, a break below this trend line could cause Bitcoin to revisit toward the $62,000 level. However, the king coin is in a critical position with the next few hours dictating the direction that it will head. A drop beneath $62,000 could be detrimental to Bitcoin as it could lead the first digital asset towards the supports at $59,000, $57,000, and $55,000.
Moreover, if the buyers can rebound from the current support level at $62,819, the first level of resistance lies at $64,000. Above this, further resistance is expected at $66,000. This may likely follow by the potential resistance at $71,000, $73,000, and $75,000 levels. Presently, the Relative Strength Index (14) is facing the south, indicating more bearish signals.
BTC/USD Medium-Term Trend: Bullish (4H Chart)
As reveals by the 4-hour chart, the Bitcoin price is seen hovering at $62,857 as the coin trades below the 9-day and 21-day moving averages with sellers forcing its price down to the lows of $62,372. However, if the bulls decide to push the market price back above the moving averages, the coin may likely hit the resistance at $66,000 and above.
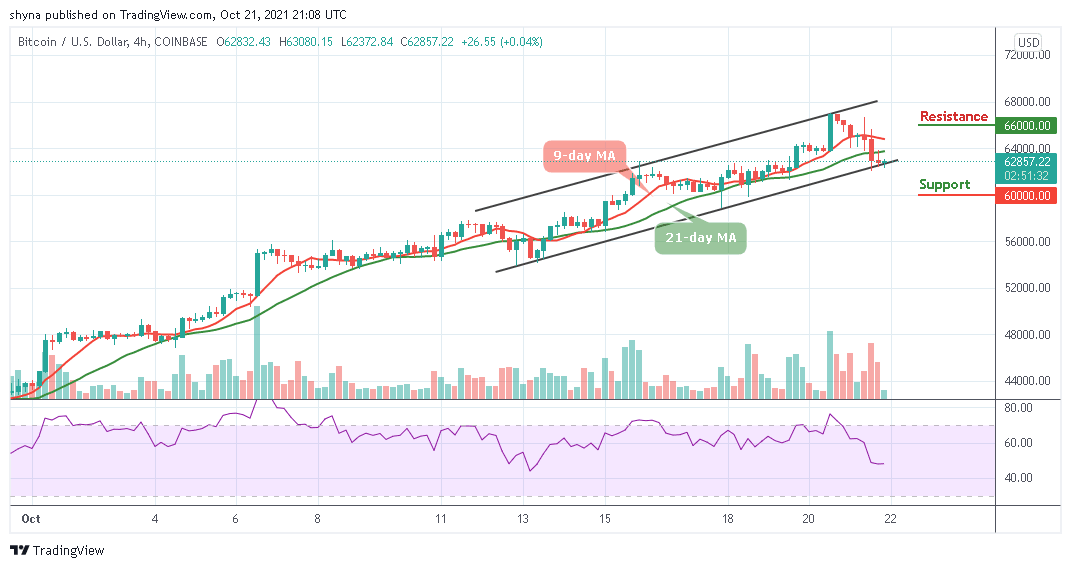
However, it now appears that the cryptocurrency is at risk of seeing further downside in the near term, as the attempt to drop below the $62,000 support seems to indicate that bears are building momentum. More so, the Relative Strength Index (14) remains around 50-level and the coin may locate the critical support at $60,000 and below.
Looking to buy or trade Bitcoin (BTC) now? Invest at eToro!
67% of retail investor accounts lose money when trading CFDs with this provider
Read more:
Join Our Telegram channel to stay up to date on breaking news coverage